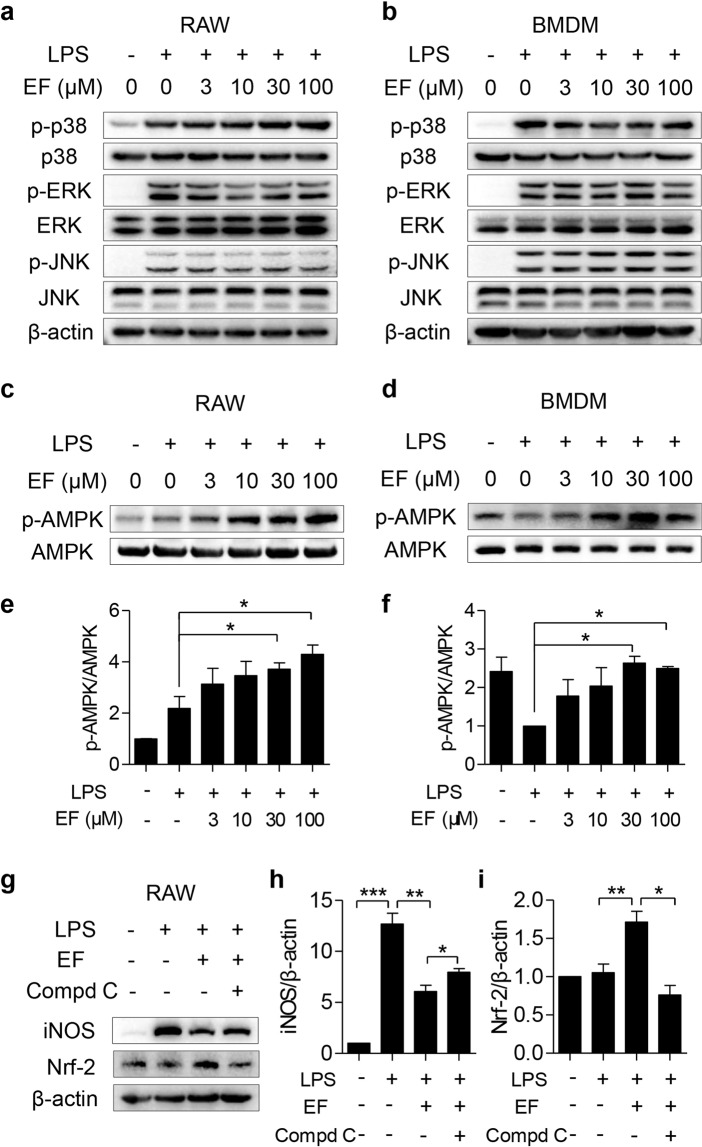
Fig. 5. EF activates the AMPK-mediated signaling pathway but fails to deactivate the MAPK pathway.
RAW264.7 cells (a) and BMDMs (b) were pretreated with EF (0, 3, 10, 30, and 100 μM) for 0.5 h, followed by stimulation with LPS (100 ng/mL) for another 0.5 h. a, b The total protein of cells was extracted, and the expression levels of p-p38, p38, p-JNK, JNK, p-ERK, and ERK were analyzed by Western blot with β-actin as the loading control. RAW264.7 cells (c, e) and BMDMs (d, f) were plated in 6-well plates, pretreated with EF (0, 3, 10, 30, and 100 μM) for 0.5 h, and then challenged with LPS (100 ng/mL) for another 0.5 h. c, d The protein expression levels of p-AMPK and AMPK were measured using Western blot analysis. e, f The ratio of p-AMPK/AMPK was quantified using ImageJ software. g–i RAW264.7 cells pretreated with 5 μM Compd C were treated with EF (100 μM) for 0.5 h and then challenged with LPS (100 ng/mL) for another 24 h. The protein expression levels of iNOS and Nrf2 were measured, β-actin was used as a loading control (g), iNOS/β-actin (h), and Nrf2/β-actin (i) were analyzed by ImageJ software. Data are shown as the mean ± SEM, n = 3, *P < 0.05; **P < 0.01; ***P < 0.001.

