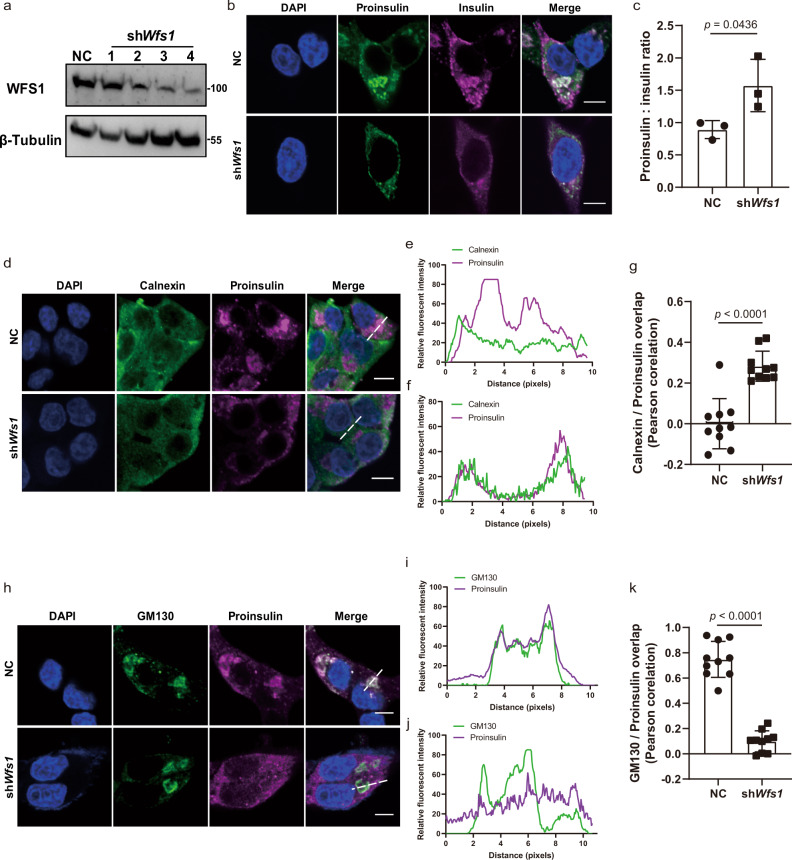
Fig. 1. Proinsulin translocation from the ER to the Golgi is impaired in shWfs1 cells.
a IB analysis of WFS1 protein in INS1 cells stably expressing the scrambled (NC) and four shRNA plasmids targeting Wfs1; β-tubulin was used as the loading control. The fourth clones were used for the following study. n = 3 independent experiments. b Representative images of immunofluorescence staining of proinsulin and insulin in the WT and shWfs1 INS1 cells. The WT and shWfs1 INS1 cells were immunostained with anti-proinsulin and anti-insulin primary antibodies, followed by Alexa Fluor-conjugated secondary antibodies. Scale bar, 5 μm. c The ratio of the fluorescence intensity of proinsulin to insulin was quantified by ImageJ software, n = 3 independent experiments. d–k Confocal microscopy analysis of colocalization of proinsulin with calnexin (ER marker, d–g) or GM130 (Golgi marker, h–k) in the WT and shWfs1 INS1 cells. Trace outline is used for line-scan (white dashed line) analysis of the relative fluorescence intensities of proinsulin with calnexin or GM130 signals. Signal overlap is quantified by Pearson correlation analysis. n = 3 independent experiments, n = 10 independent images quantified. Scale bar, 5 μm. All the data are presented as mean ± s.e.m. p < 0.05, significant, using a two-tailed Student’s t-test. Source data are provided as a Source Data file.

