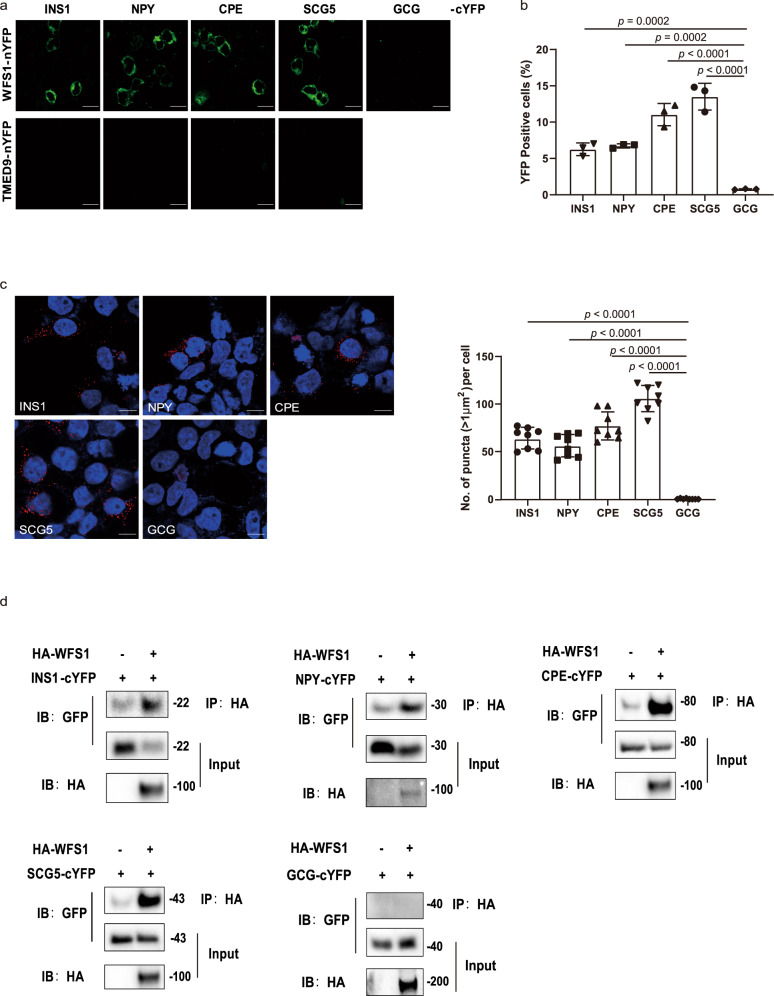
Fig. 3. WFS1 interacts with vesicular cargo proteins.
a Representative live imaging of reconstituted BiFC fluorescence between WFS1-tagged nYFP or nYFP-tagged TMED9 and vesicular cargo protein (INS1, NPY, CPE, SCG5, and negative control GCG)-tagged cYFP. Green fluorescence shows reconstitution of YFP as an indicator of protein–protein interactions. Scale bar, 10 μm. b The interaction between WFS1 and vesicular cargo proteins evaluated by BiFC, and then quantified by flow cytometry. n = 3 independent experiments. c Representative imaging of the interaction between WFS1 and vesicular cargo proteins by PLA. PLA is a powerful tool that allows in situ detection of protein interactions with single molecule resolution. HEK-293T cells expressing HA-tagged WFS1 and vesicular cargo protein-tagged cYFP were fixed, and then incubated with mouse anti-HA and rabbit anti-GFP antibody for 1 h at 37 °C, PLA was then performed using anti-rabbit PLUS and anti-mouse MINUS PLA probes. The red puncta represent the interaction between one WFS1 protein and one cargo protein. The puncta number per cell was quantified by ImageJ software. n = 3 independent experiments, n = 8 independent images quantified. Scale bar, 10 μm. d Co-IP analysis of WFS1 and vesicular cargo proteins. Proteins were transiently expressed in HEK-293T cells, and immunoprecipitates pulled down by HA antibody were analyzed by IB with the indicated antibodies. GCG was used as a negative control. Input represents 5% of the total cell extract used for immunoprecipitation. Molecular weights are in kDa. n = 3 independent experiments. All the data are presented as mean ± s.e.m. p < 0.05, significant, using a two-tailed Student’s t-test. Source data are provided as a Source Data file.

