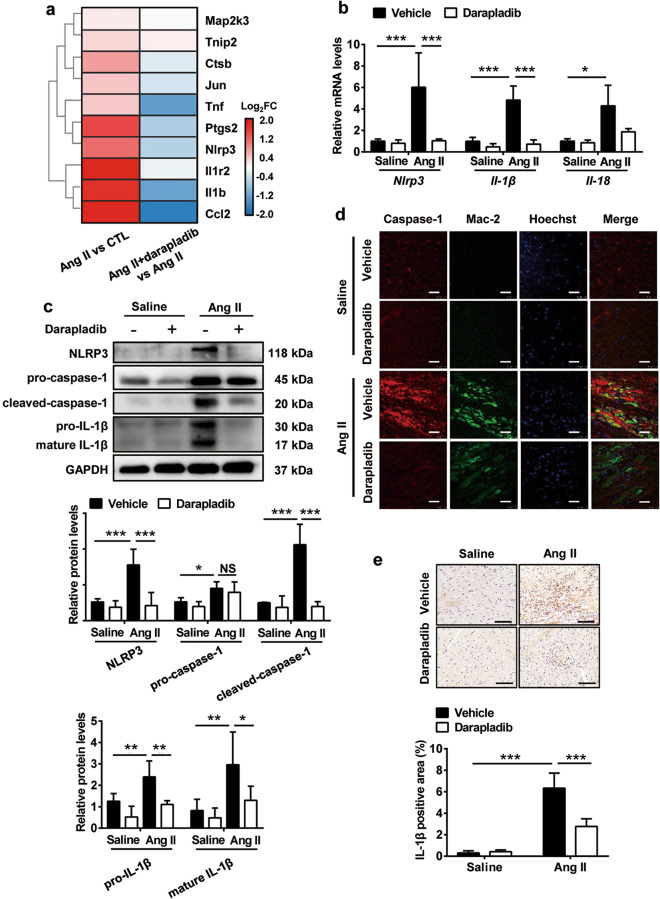
Fig. 6. Inhibition of Lp-PLA2 by darapladib attenuated Ang II infusion-induced NLRP3 inflammasome activation.
C57BL/6J mice received darapladib (50 mg·kg−1d−1) or vehicle by gavage and were infused with saline or Ang II (1500 ng·kg−1·min−1) for 7 days. a Hearts were detected by RNA-seq analysis, and NLRP3 inflammasome-associated genes are shown in the heatmap (n = 3). The color bar represents the log-transformed and normalized relative fold change (FC) of genes. b RT-PCR analysis of Nlrp3, Il-1β, and Il-18 mRNA expression levels in the heart tissues (n = 5). c Western blot analysis of NLRP3 inflammasome-associated proteins (NLRP3, pro-caspase-1, cleaved-caspase-1, pro-IL-1β, and mature IL-1β) in hearts and the quantification of protein bands (n = 6). d Double immunofluorescence analysis of macrophage (Mac-2, green) and caspase-1 (red) expression in hearts. Hoechst nuclear staining is shown in blue. Three independent experiments were performed. Scale bar = 25 μm. e Immunohistochemical staining of IL-1β in the hearts (n = 5; scale bar = 200 μm). Data are presented as the mean ± standard deviation, and n represents the number of animals. P adj < 0.05 is considered to be different, *P < 0.05, **P < 0.01, ***P < 0.001.

