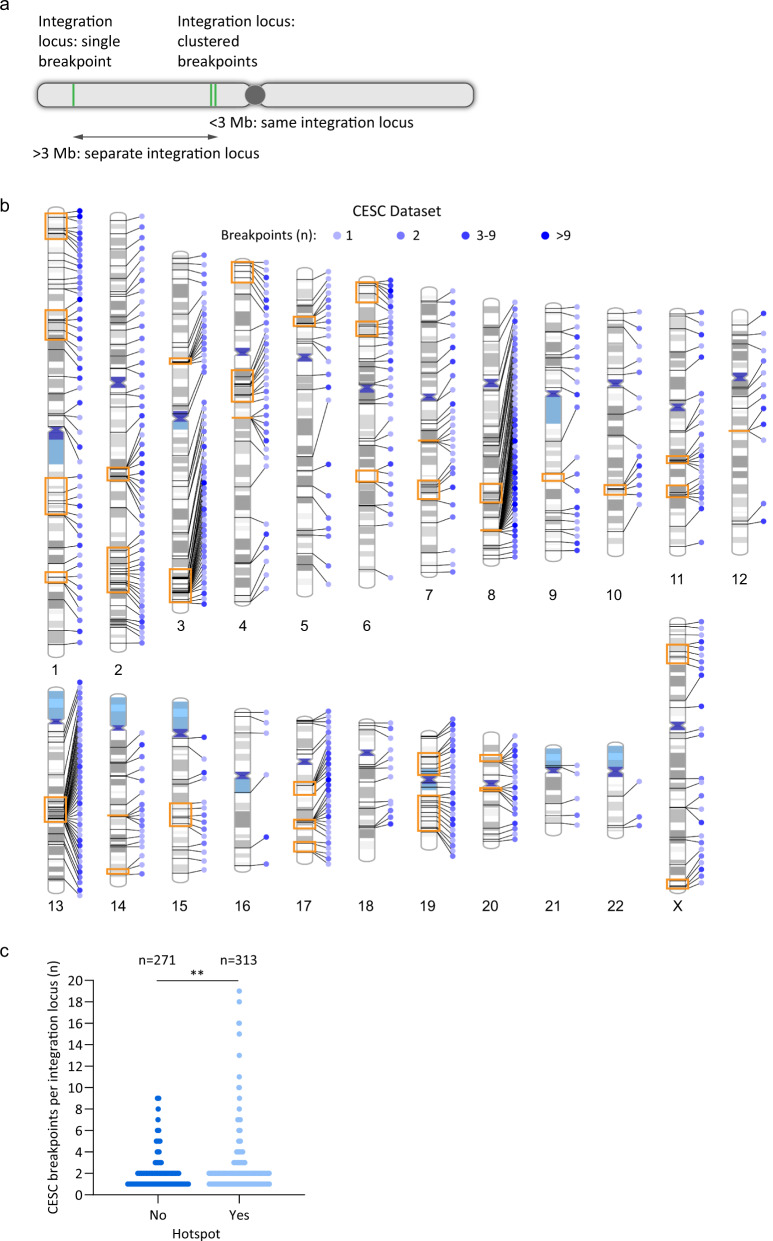
Fig. 2. HPV integration loci frequently contain clustered insertional breakpoints.
a Schematic representation of HPV integration breakpoints and loci. Green lines represent integration breakpoints. Integration loci are defined as either a single breakpoint, or multiple, closely spaced breakpoints (a cluster). Samples with clustered breakpoints within the same chromosome are classified as a single integration locus if the 5′ and 3′ most breakpoints are within 3 Mb of each other. b Schematic representation of clustered breakpoints at CESC integration loci across the human genome. Lines connecting to each chromosome represent different integration loci. Blue circles represent the indicated number of breakpoints per integration locus; orange boxed regions represent integration hotspots. See Supplementary Fig. 3 for the distribution of clustered breakpoints at integration loci in HNSCC tumors. c Scatter plot showing the frequency of single and clustered breakpoints per integration locus for CESC tumors grouped according to whether they overlap integration hotspots. The p-value is based on a non-parametric, unpaired t-test (two-tailed; **P < 0.01).

