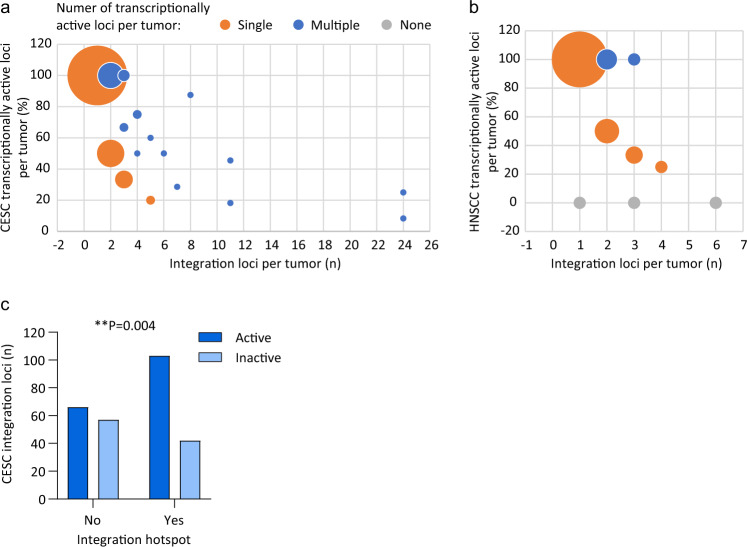
Fig. 3. Transcription status of integrated viral genomes.
a, b Bubble graph showing the percentage of transcriptionally active integration loci per tumor in CESC (a) and HNSCC (b) samples relative to the number of integration loci per tumor; 100% indicates that all integration loci are active in that tumor. Orange, blue and gray circles represent tumors with a single, multiple or no transcriptionally active loci, respectively. Circle size indicates the number of samples per grouping (for CESC, largest, n = 86 and smallest, n = 1; for HNSCC, largest, n = 21 and smallest, n = 1). Three HNSCC samples (TCGA-CR-6482, TCGA-CN-5374, and TCGA-CR-7404) were reported as integration negative from RNA-seq32 but had a single or multiple integration loci detected through WGS5 and were therefore classified as transcriptionally inactive. c Bar chart showing the number of CESC integration loci that are transcriptionally active or inactive for viral oncogene expression at integration hotspots. Association between viral oncogene transcription and integration hotspots was based on a Fisher’s exact test (two-tailed; **P < 0.01).

