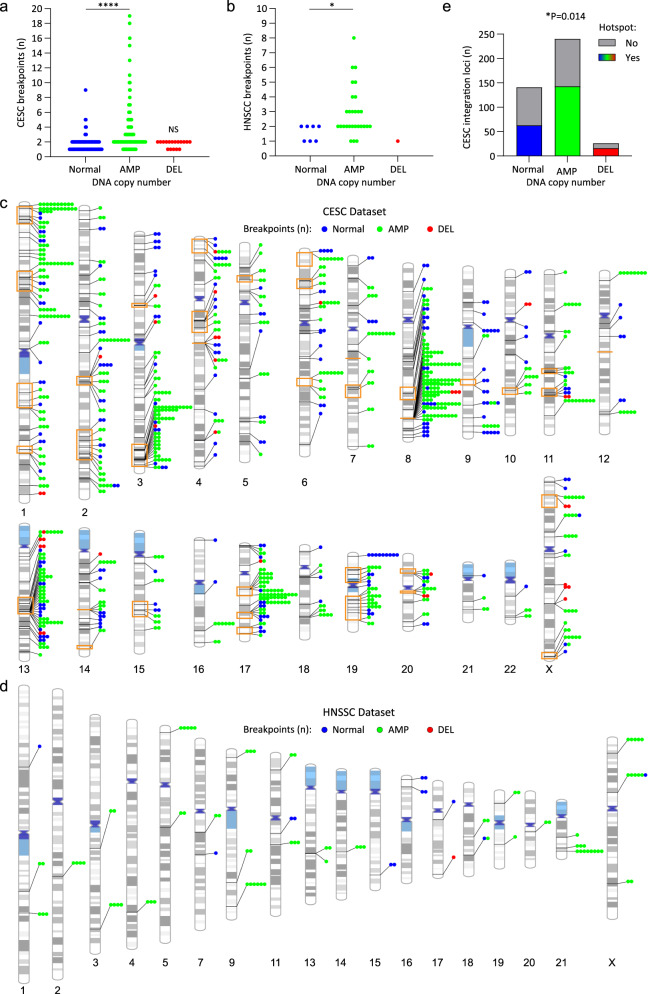
Fig. 4. Clustered integration breakpoints are associated with amplified regions of the host genome in CESC and HNSCC.
For the subset of CESC and HNSCC samples that had matched somatic copy number alteration data, HPV integration breakpoints were grouped according to the associated host DNA copy number status. Normal, AMP (amplification) and DEL (deletion) refers to the genomic profile of the host DNA at the integration locus. a, b Scatter plots showing the number of breakpoints per locus grouped according to the somatic copy number alteration status of the integration locus for CESC (a) and HNSCC (b) tumors. For CESC, the number of integration loci per grouping was Normal, n = 140; AMP, n = 240 and DEL, n = 17. For HNSCC, the number of integration loci per grouping was Normal, n = 7; AMP, n = 28 and DEL, n = 1. P-values are based on non-parametric, unpaired t-tests (two-tailed; *p < 0.05, ****p < 0.0001, NS = nonsignificant). All statistical tests were performed relative to integration loci with a normal genomic profile. DNA amplification associated with integration loci ranged from 693 bp to 54.2 Mb (average, 1.6 Mb; median 47.4 Kb) in CESC and 6.5 Kb to 102.7 Mb (average, 3.3 Mb; median 43.1 Kb) in HNSCC. c, d Schematic representation of clustered breakpoints at integration loci that have associated host somatic copy number alterations. Lines connecting to each chromosome represent different integration loci for the CESC (c) and HNSCC (d) datasets. The number of circles represents the number of breakpoints per integration locus. Blue, green and red colored circles respectively represent integration sites that have a normal genomic profile or associated amplifications or deletions. Orange boxed regions represent integration hotspots. e Stacked bar chart showing the number of CESC integration loci that overlap integration hotspots grouped according to whether they have associated somatic copy number alterations. Association between somatic copy number alterations and integration hotspots was based on a chi-square test (*p < 0.05).

