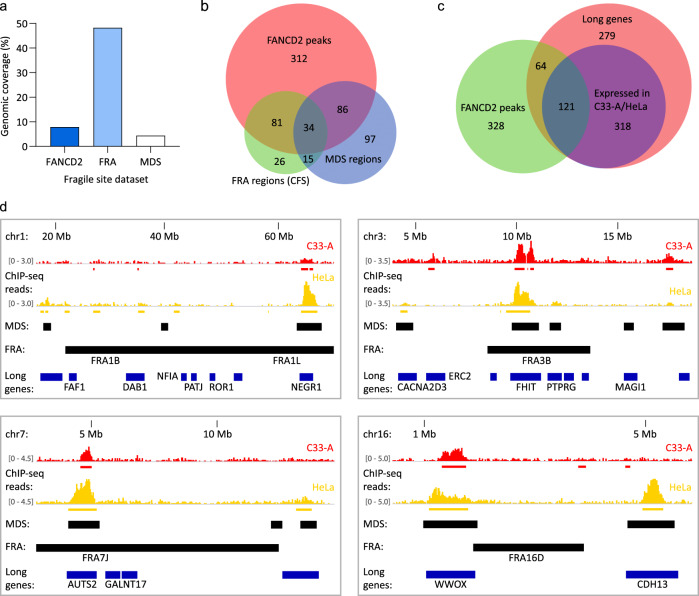
Fig. 5. Cervical keratinocyte-specific fragile sites mapped by FANCD2 ChIP-seq.
HPV-negative (C33-A) and HPV18-positive (HeLa) cervical carcinoma cells were treated for 24 h with 0.2 µM aphidicolin and FANCD2-enriched regions were identified by ChIP-seq. All analyses were performed using the combined C33-A and HeLa FANCD2 dataset. a Bar graph showing the genomic coverage of FANCD2-enriched regions relative to common fragile sites (FRA regions) and mitotic DNA synthesis (MDS) regions reported in the literature19,20. b Venn diagram showing the regions of overlap between fragile sites identified in the FANCD2, FRA, and MDS datasets. c Venn diagram showing the overlap of FANCD2-associated fragile sites with protein-coding genes longer or equal to 0.3 Mb. Red circle represents all long genes; blue circle represents long genes that are expressed in C33-A and/or HeLa cells. d Alignment of FANCD2-enriched regions in C33-A (red) and HeLa (yellow) cells with associated genes (blue bars represent genes >0.3 Mb; genes expressed in C33-A and/or HeLa cells are indicated by gene name), and FRA and MDS regions (black bars). Red and yellow bars below the FANCD2 ChIP-seq signal tracks represent peaks mapped by SICER analysis in the corresponding cell lines. Relative ChIP-seq peak heights are indicated in square parentheses.

