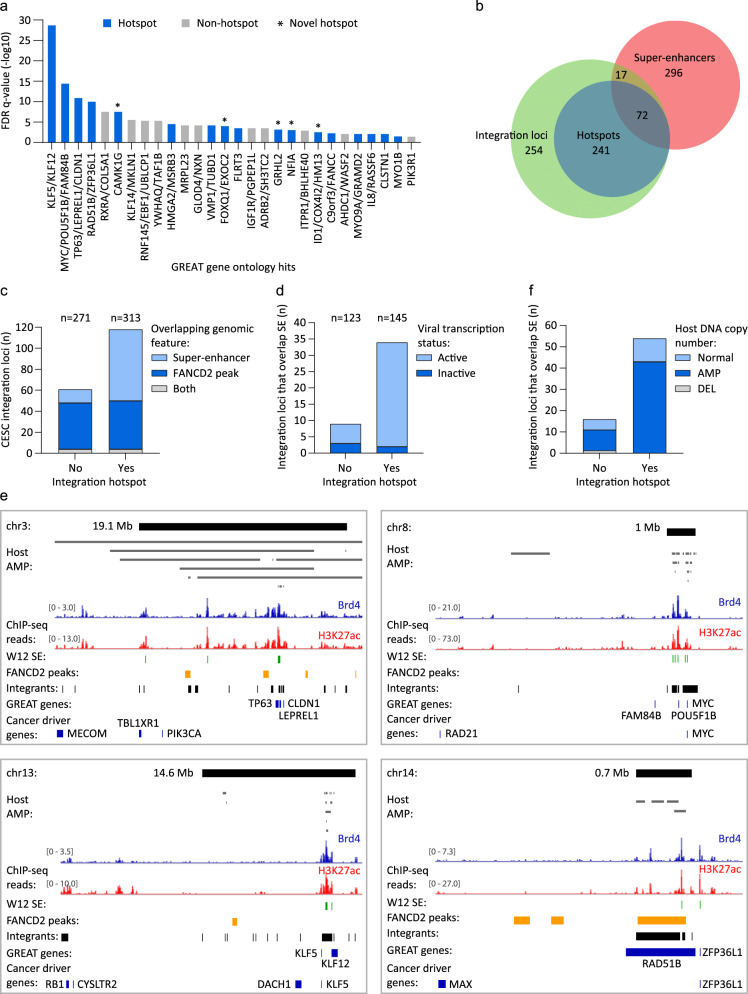
Fig. 6. Integration hotspots are associated with cellular super-enhancers.
H3K27ac- and Brd4-enriched regions were profiled in HPV16-positive cervical derived W12 keratinocyte subclones by ChIP-seq. Enhancer regions were defined as peaks that overlapped in both H3K27ac and Brd4 datasets, and that were identified across the four W12 subclones. a GREAT (Genomic Regions Enrichment of Annotations Tool) Gene Ontology analysis was performed using W12 enhancers that overlapped CESC integration breakpoints (±50 Kb flanks) as input and compared against all W12 enhancers, to identify putative target genes associated with these cis-regulatory regions based on enhancer frequency. Bars represent putative target genes plotted against their FDR (false discovery rate) adjusted p-values (q-value). Blue and gray bars represent genes that overlap integration hotspots and sites of non-recurrent integration, respectively. Enriched target genes within the same genomic locus were grouped (e.g., KLF5 and KLF12) and plotted using the most significant q-value. b Venn diagram showing the regions of overlap between integration loci, integration hotspots, and super-enhancers mapped in W12 subclones. c Bar chart showing the number of CESC integration loci that were grouped according to whether or not they are integration hotspots and plotted based on their overlap with super-enhancers, FANCD2-associated fragile sites, or both genomic features. Numbers above the graph indicate the total number of integration loci within each grouping. d Bar chart showing the number of CESC integration loci that are associated with super-enhancers (SE) that were grouped according to whether they are integration hotspots and plotted based on their viral transcription status. Numbers above the graph indicate the total number of integration loci that have associated viral transcription data within each grouping. e Alignment of Brd4 (blue) and H3K27ac (red) ChIP-seq signals mapped in W12 cervical keratinocytes at integration hotspots (top black bars; size indicated in Mb) in cervical carcinomas. Relative ChIP-seq peak heights are indicated in square parentheses. Gray bars represent amplified (AMP) host DNA in different CESC tumors from The Cancer Genome Atlas. Green, yellow, and black bars below the ChIP-seq signal tracks represent super-enhancers (SE) mapped in W12 subclones, FANCD2-associated fragile sites mapped in C33-A and HeLa cells, and CESC integration loci, respectively. Genes identified from GREAT Gene Ontology analysis53 and cancer driver genes56 are indicated by blue bars. Each integration hotspot is characterized in Supplementary Fig. 5 and Supplementary Data Table 4. f Bar chart showing the number of CESC integration loci that are associated with super-enhancers (SE) that were grouped according to whether they are integration hotspots and plotted based on their host somatic copy number alternation status. The number of integration loci per grouping was normal, n = 140, amplification (AMP), n = 240, and deletion (DEL), n = 17.

