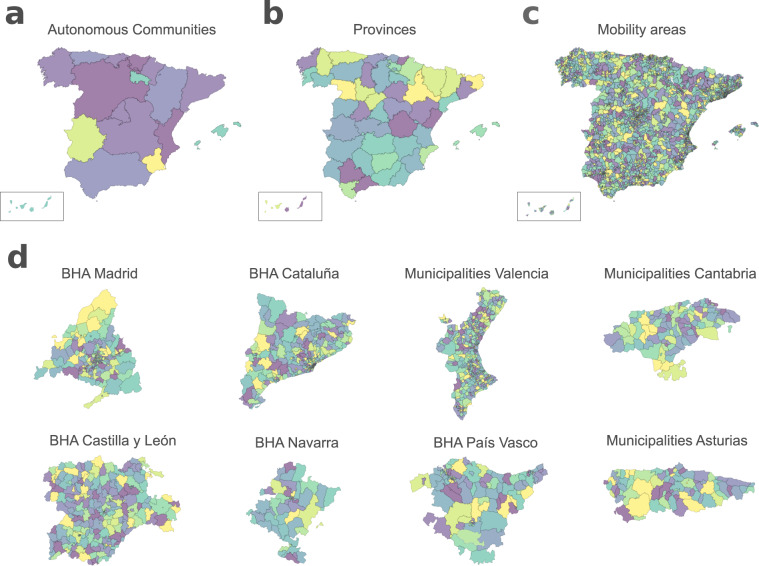
Fig. 4.
The figure represents the different geographical layers included in the database. In (a) and (b) the coloured polygons correspond to the different autonomous communities and provinces of Spain, respectively. For simplicity, the Canarias islands are represented in the bottom left box. Panel (c) represents the MITMA mobility layer and the coloured polygons correspond to individual mobility zones that match district in high-density populated areas and municipalities or groups of municipalities in less populated areas. Panel (d) represents the layers for which some autonomous communities report COVID-19 cases at a higher spatial resolution than the province level. From top to bottom and left to right the layers: Madrid’s BHAs, Cataluña’s BHAs, Valencia’s Municipalities, Cantabria’s municipalities, Castilla y León BHAs, Navarra’s BHAs, País Vasco BHAs, Asturias’ municipalities. In all the plots colours are only used for visualisation purposes.

