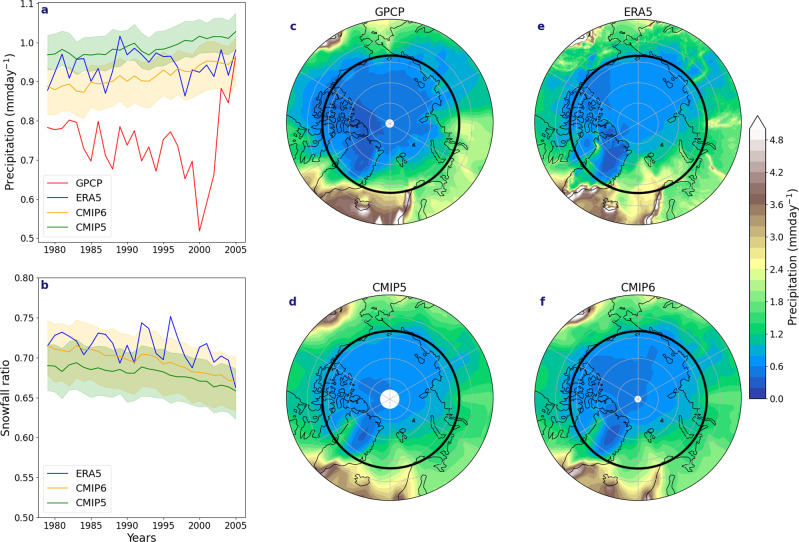
Fig. 1. Time series of precipitation, and snowfall ratio and spatial climatology of total precipitation.
a Annual precipitation means over the Arctic (70°N–90°N) from 1979 to 2005, covering the satellite era and the start of the GPCP record concluding with the end of the historical period for GPCP, ERA5, CMIP5 and CMIP6. b Annual snowfall ratio (snowfall/total precipitation) over the Arctic for the same observational record of 1979–2005 for ERA5, CMIP6 and CMIP5. The shading in both represents the 5th to 95th percentile spread in the models. Climatological precipitation for the same record over the Arctic for c GPCP, d CMIP5, e ERA5 and f CMIP6. The Arctic region for all time series analyses is taken as the area poleward of 70°N, shown as the dark circle in c–f.

