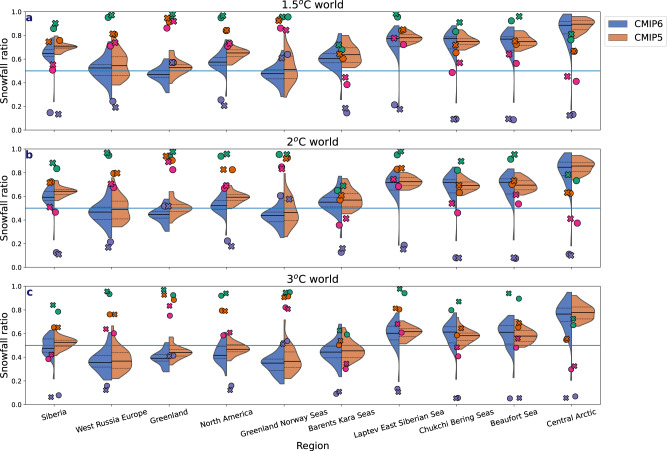
Fig. 10. Snowfall ratio per region in a 1.5 °C, 2 °C and 3 °C global warming scenarios.
The snowfall ratio for different regions (identified in Supplementary Fig. 4) across the Arctic following 1.5 °C, 2 °C and 3 °C global warming for CMIP6 (blue) and CMIP5 (orange) with the dashed black lines showing the 25th–75th and the solid black lines showing the multi-model mean. The solid blue line identifies when the snowfall ratio is at 0.5. The circles and x’s represent the multi-model ensemble mean snowfall ratio at 1.5 °C, 2 °C and 3 °C for CMIP6 (circles) and CMIP5 (x’s) for December–February (green), March–May (orange), June–August (purple) and September–November (pink).

