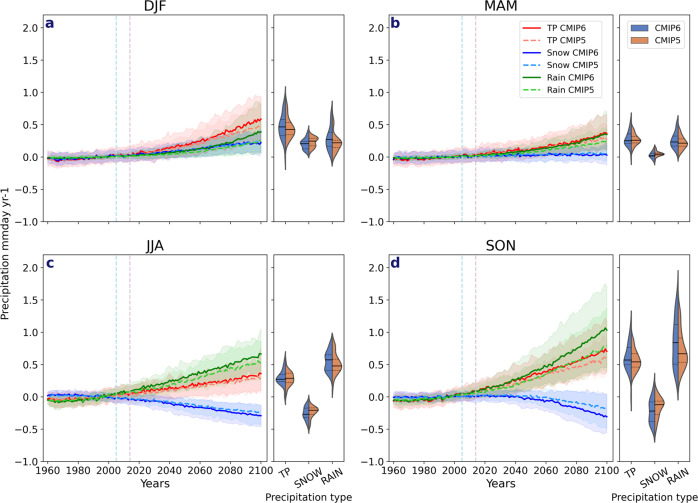
Fig. 2. Time series of total precipitation, snowfall and rainfall anomalies.
Changes in total precipitation (TP) (red, orange), snowfall (snow) (blue, light blue) and rainfall (rain) (green, light green) in CMIP6 and CMIP5 are shown relative to the 1981–2009 climatological mean for a December–February (DJF), b March–May (MAM), c June–August (JJA) and d September–November (SON). The light blue vertical dashed line denotes when the historical period for CMIP5 ends and the light purple vertical dashed line denotes when the historical period of CMIP6 ends and thereafter the RCP8.5 and SSP5–8.5 climate scenarios for CMIP5 and CMIP6 are used. The shading around each line highlights the spread based upon the lower 5th and 95th percentiles among the model members. The violin plots represent the model spread from 2090 to 2100 for each total precipitation (TP), snowfall (snow) and rainfall (rain) with the dashed black lines representing the 25th and 75th percentiles, and the black vertical line representing the mean of all models.

