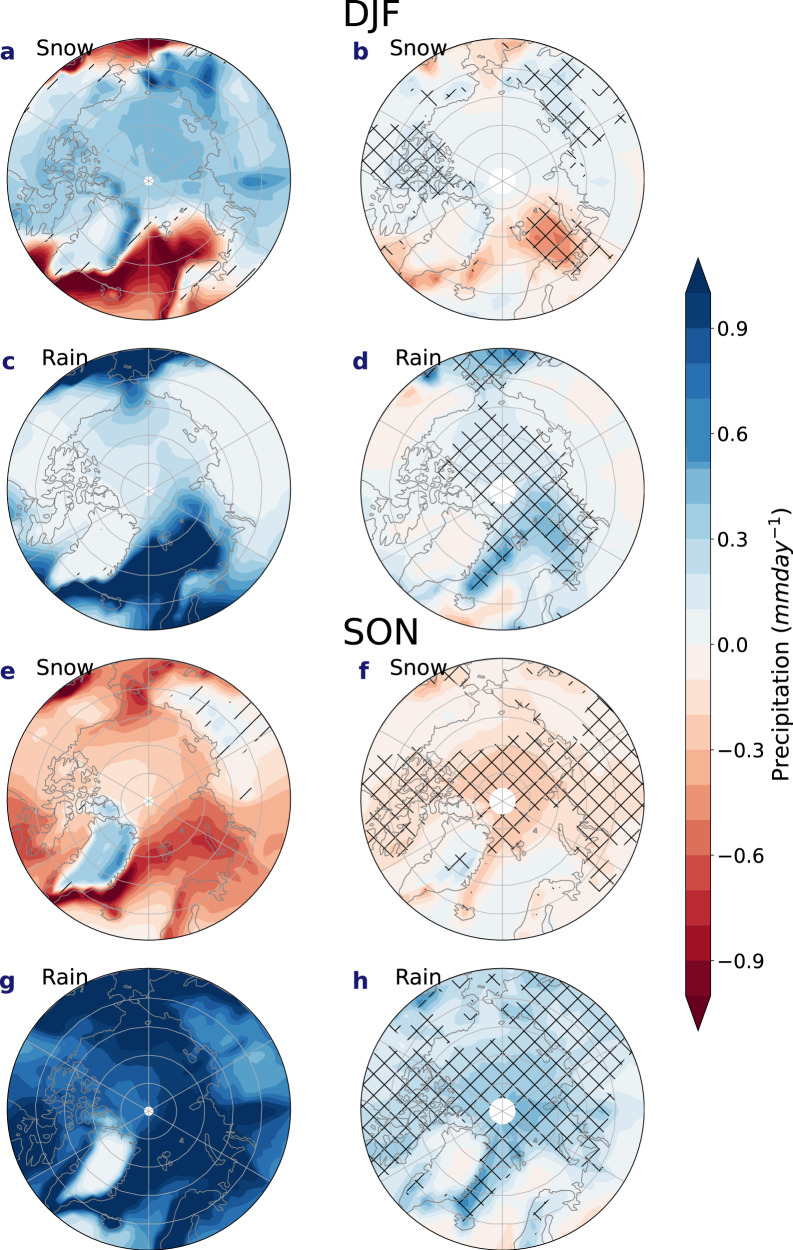
Fig. 3. Snowfall and rainfall changes in CMIP6 and difference between CMIP6 and CMIP5 snowfall and rainfall at the end of the century.
The left-hand column shows the changes in a, e snowfall and c, g rainfall at the end of the century in a, c December–February (DJF) and e, g September–November (SON) in CMIP6. Straight line hatching indicates regions where differences are not statistically significant at the 95% confidence level. The right-hand column shows the difference in b, f snowfall and d, h rainfall at the end of the century (2091–2100) relative to the start of the century (2005–2014) between CMIP5 and CMIP6 (CMIP6–CMIP5) for b, d December–February and f, h September–November. Hatching indicates statistical significance at 95% confidence level.

