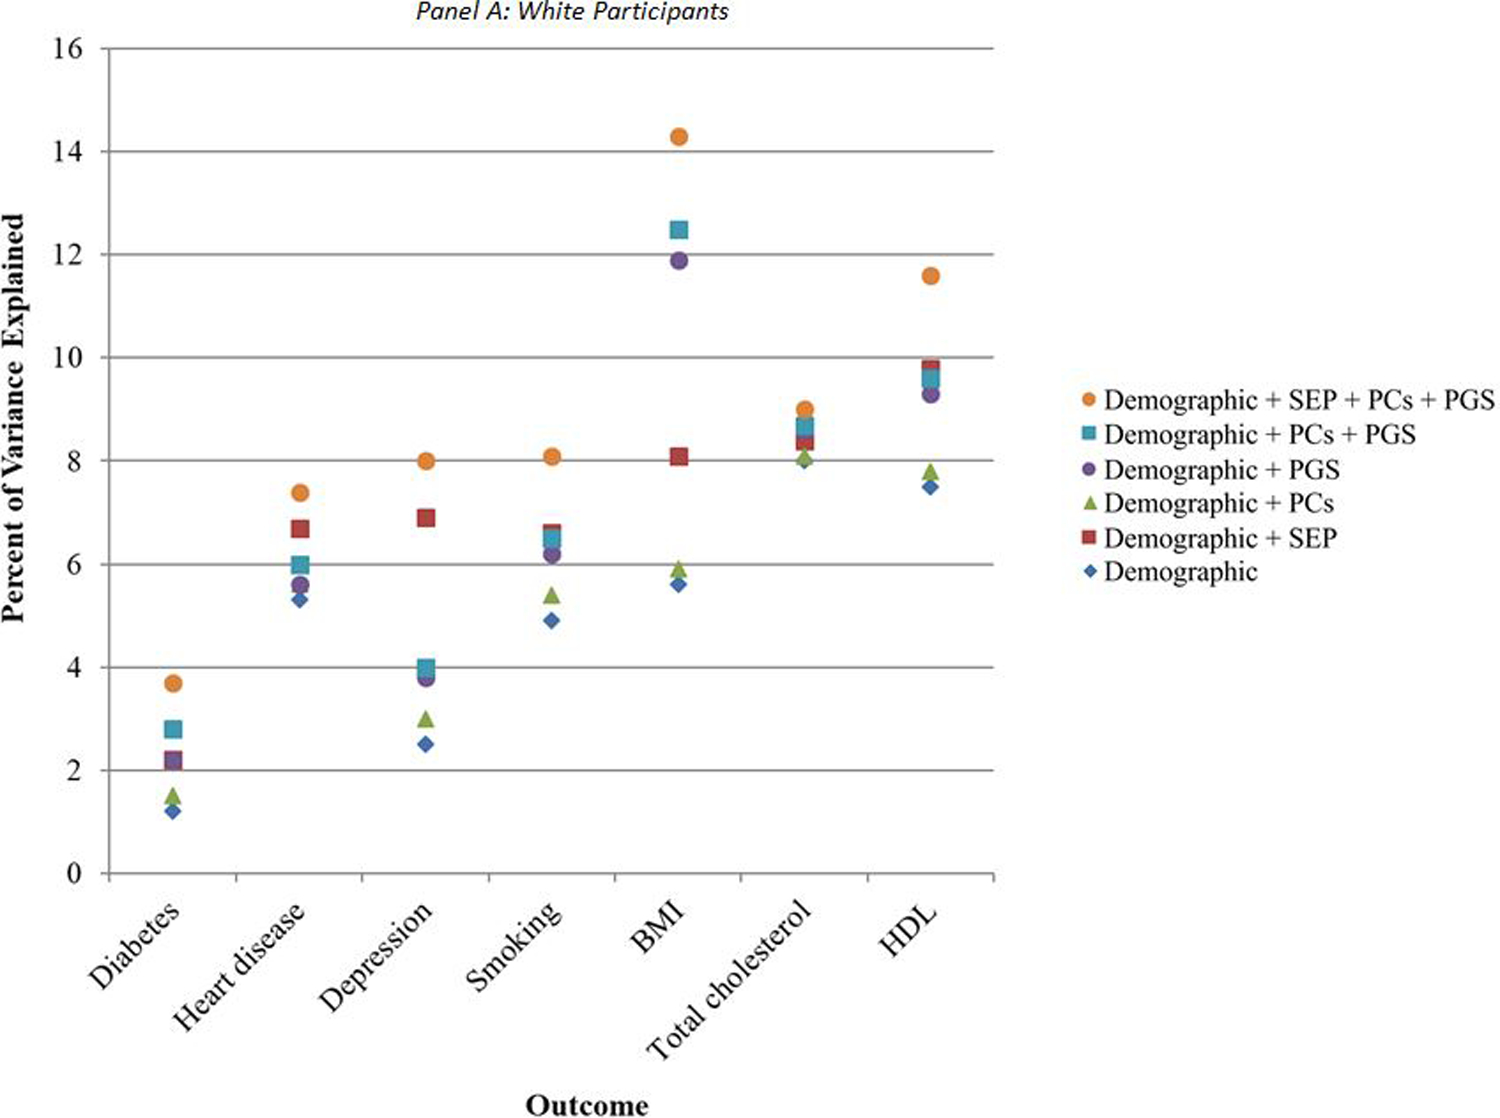
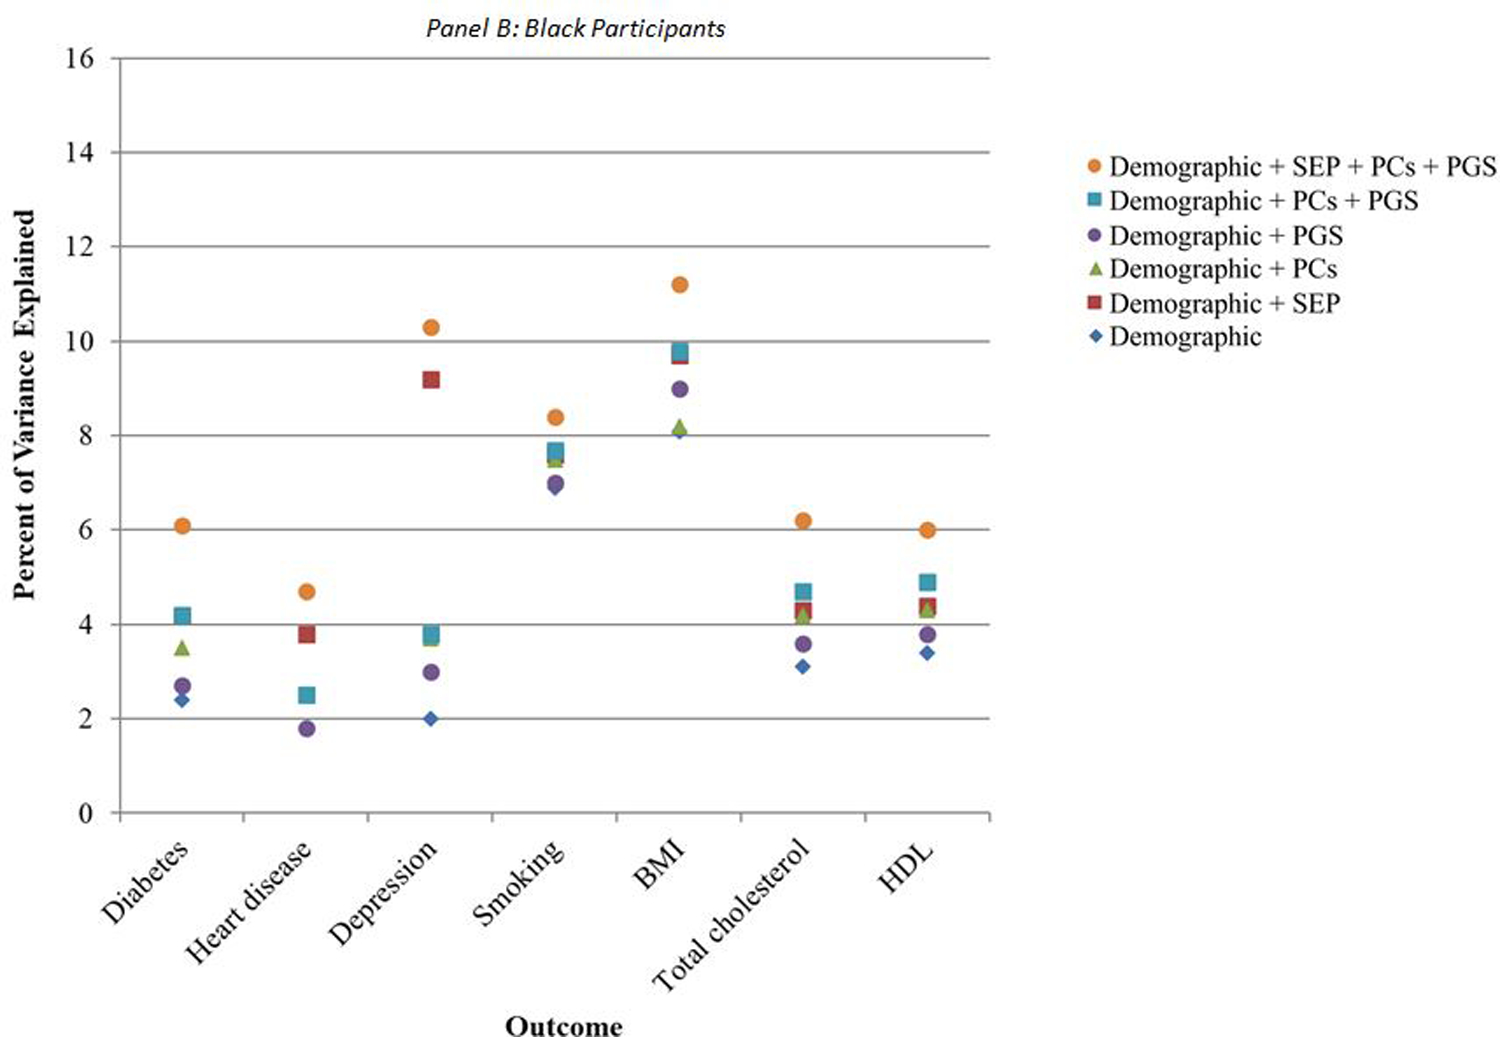
Figure 1. Percent of variance explained by demographic, socioeconomic, and genetic covariates.


Note: N = 7,522 white participants and 1,198 Black participants. Percent of variance explained is the R-squared value from a multivariate linear regression of the given outcome on the given combination of covariates. BMI: body mass index; HDL: high-density lipoprotein cholesterol; PCs: principal components for genetic ancestry; PGS: polygenic score specific to relevant health condition; SEP: socioeconomic position.
