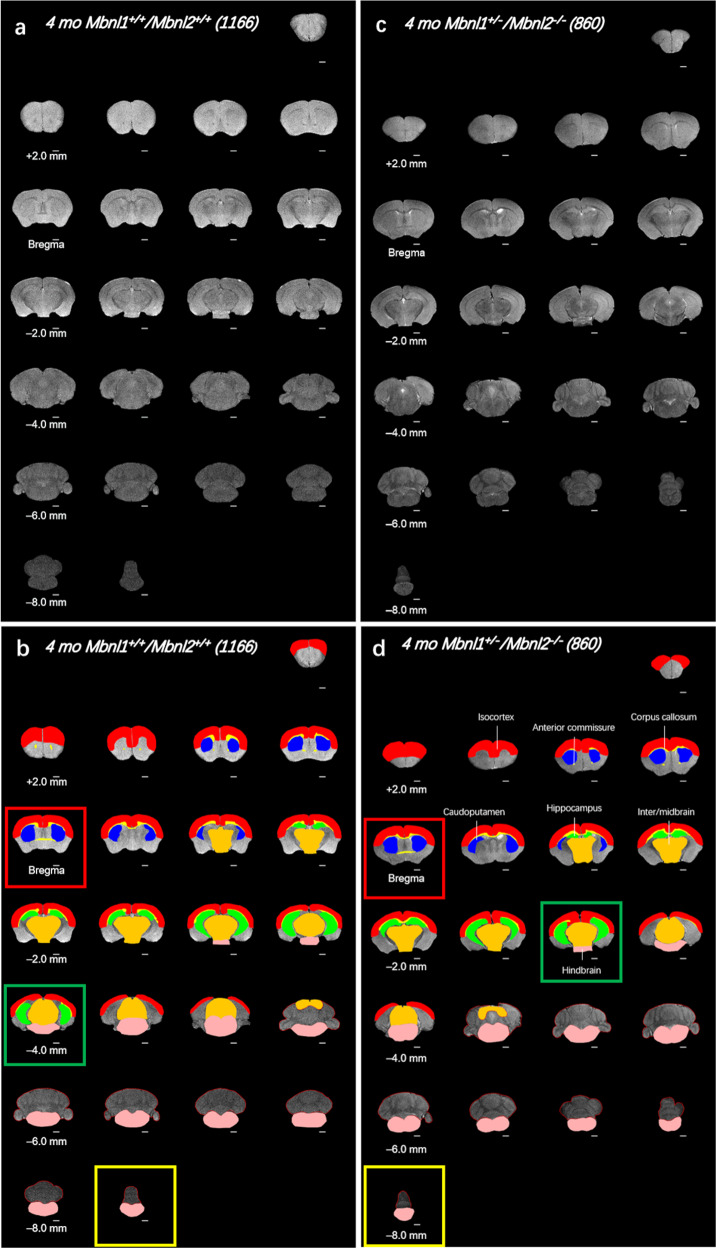
Fig. 1. Whole-brain FSE T2w MRI slices of 4mo Mbnl1+/−/Mbnl2−/− mice show wide-spread regional volume alterations.
a, c A montage of 2D FSE T2w MRI brain slices of representative Mbnl1+/+/Mbnl2+/+ (wild-type control) and Mbnl1+/−/Mbnl2−/− mice that underwent in vivo scanning are shown, respectively. Mouse identifier numbers are shown in parenthesis. b, d Manually defined, color-filled regions of interest (ROI) overlaid onto structural FSE T2w MRI slices are shown. All ROIs that are significantly different between the two genotypes are displayed. Color code: white matter regions, which include the anterior commissure and the corpus callosum/external capsule (yellow). Gray matter regions, which include the isocortex (red), the caudoputamen (blue), the hippocampus (green), the inter-/midbrain (orange), and the hindbrain (pink). Calculated areas from the ROIs were multiplied by the image-slice thickness to generate ROI volumes shown in Figs. 2 and 3. The olfactory bulb was excluded in volume measurements. Slice positions are identified based on Bregma locations. The slice where the anterior commissure is connected between hemispheres approximates Bregma, which is defined as 0.0 mm. Going from rostral to caudal slice positions, boxes indicate structural landmarks that include Bregma (red box), the last slice containing hippocampal regions (green box), and the end of the brain (yellow box). Slice thickness = 0.5 mm. Scale bar = 1 mm.

