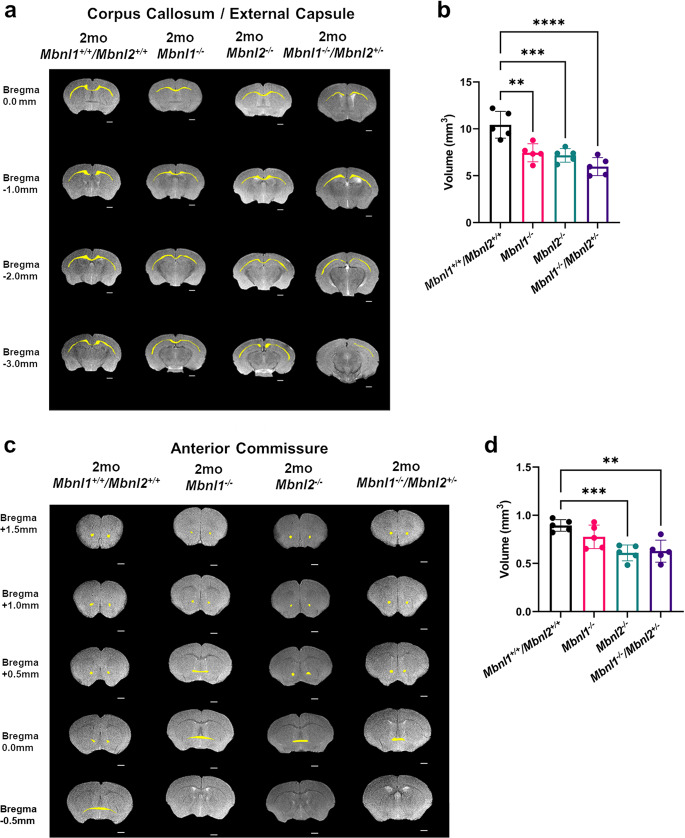
Fig. 6. White matter regional volume decreases in 2mo Mbnl1−/−, Mbnl2−/−, and Mbnl1−/−/Mbnl2+/− mice.
a Representative axial brain slices from FSE T2w MRI scans with the corpus callosum/external capsule volumes overlaid in yellow. b Corpus callosum/external capsule volume measurements (mean ± SD) are shown. c Representative axial brain slices from FSE T2w MRI scans with the anterior commissure volumes overlaid in yellow. d Anterior commissure volume measurements (mean ± SD) are shown. Scale bar in 2D axial images denotes 1 mm. Error bars are standard deviations (SD). In all cases, *p < 0.05, **p < 0.01, ***p < 0.001, and ****p < 0.0001.

