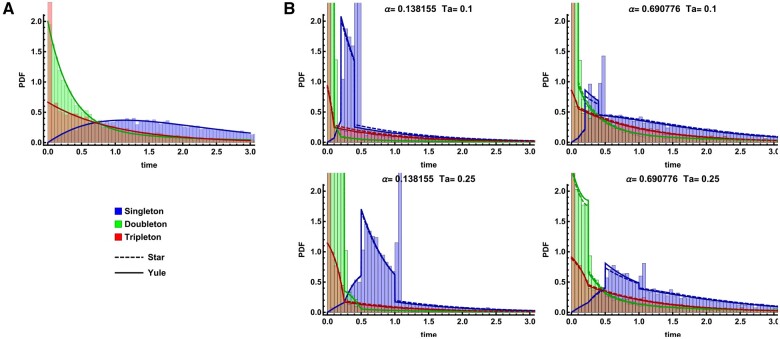
Figure 4.
Marginal i-Ton branch length distributions for n = 4. Analytic predictions under the neutral model (A) and the approximate selection models (B) are compared to the corresponding distribution obtained from 10,000 simulation replicates overlaid as a histogram. The Yule approximation is indicated by solid lines while the dashed lines indicate the star-like approximation. Results for singleton, doubleton, and tripleton branch lengths are shown in blue, green, and red, respectively. The top row shows two distances from the sweep center and . Analogous results for an older sweep at are shown in the bottom row. Time is measured in units of generations. Here, , s = 0.05, and . Note that the location and size of each point mass (e.g., the tripleton point mass at time t = 0) is reflected in the CDF rather than the PDF (Supplementary Figure S1).

