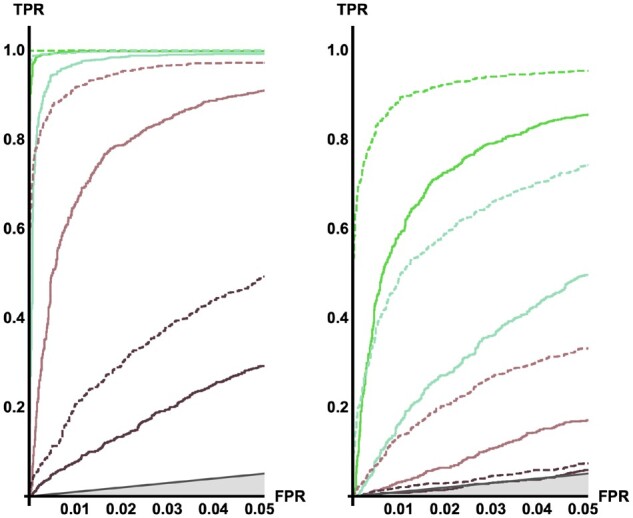
Figure 6.

ROC curve, star-like approximation. Plotting the rate of true positives against the rate of false negatives shows how much power we have to distinguish genomic regions that underwent a hard sweep from neutral replicates. As expected, power depends on the time since the sweep [ (green), 0.5 (lighter green), 1.0 (light brown), and 2.0 (dark brown)], the strength of selection (left s = 0.05, right s = 0.005) and sample size n = 4 (full line), 12 (dashed).
