Figure 7.
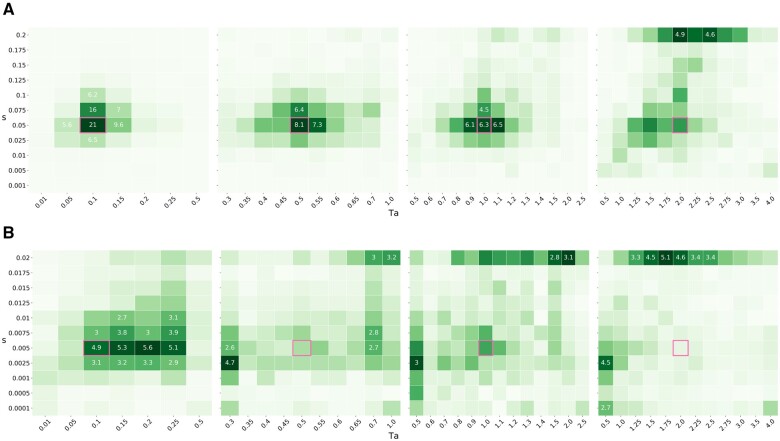
Heatmaps. Parameter estimates of the gridded optimization using the star-like approximation across simulations using a sample of n = 4 lineages. The top and bottom rows show strong and weak selection, respectively. The panels show the accuracy of our parameter estimates for simulation data with increasingly older sweeps ( from left to right). Within the panels, each square represents a parameter combination in the test grid. The number inside each square shows the percentage of replicates () associated with a particular parameter combination, with darker shading corresponding to a higher density. The true simulated parameter combination is highlighted by a pink square. (A) Strong selection, s = 0.05 and (B) weak selection, s = 0.005.

