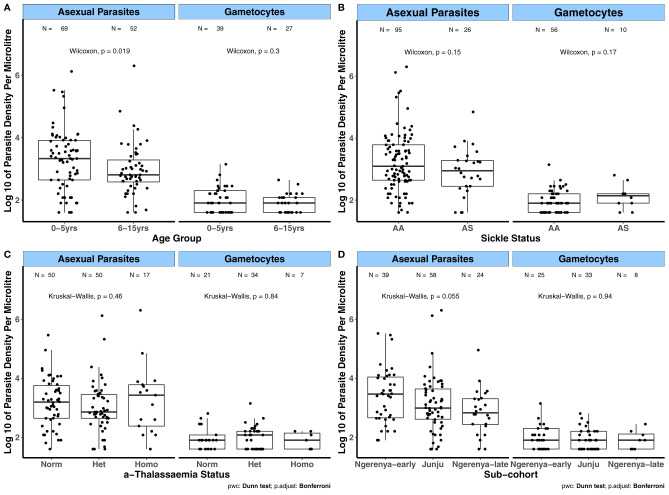
Figure 1.
Variation in patent parasite densities by factors associated with gametocyte carriage in the KMLC cohort. Asexual parasite and gametocyte densities by (A) Age group; (B) Sickle genotype; and (C) α-thalassaemia genotype. (D) Sub-cohort (moderate transmission (Ngerenya-early and Junju) and low transmission (Ngerenya-late)). Comparisons were carried out using the Wilcoxon test and Kruskal-Wallis test (post-hoc analysis after Kruskal-Wallis carried out using Dunn’s test with Bonferroni correction). The number of parasite positive individuals (N) is indicated at the top of each graph. α-thalassaemia: Norm – normal, Het – heterozygous, and Homo – homozygous. The boxes of boxplots display the median bound by the first and third quartiles, with the whiskers depicting the lowest and highest values (excluding outliers). The dots indicate individual data points.

