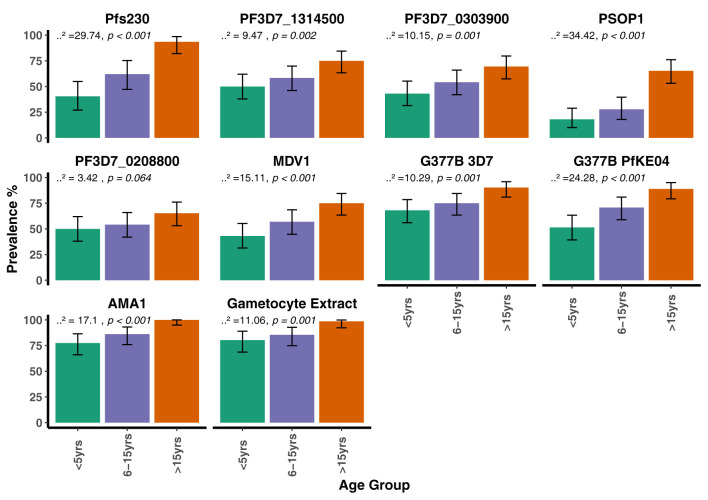
Figure 3.
Seroprevalence to the candidate antigens, AMA1 and gametocyte extract stratified by age group in the AFIRM Cohort. Bar plots showing the prevalence of antibodies to the candidate antigens, AMA1 and gametocyte extract within the different age categories. The Cochran-Armitage test for trend was used to analyze the relationship between seroprevalence and age; p values are presented at the top of each panel. Error bars show 95% binomial confidence intervals (Clopper–Pearson interval).

