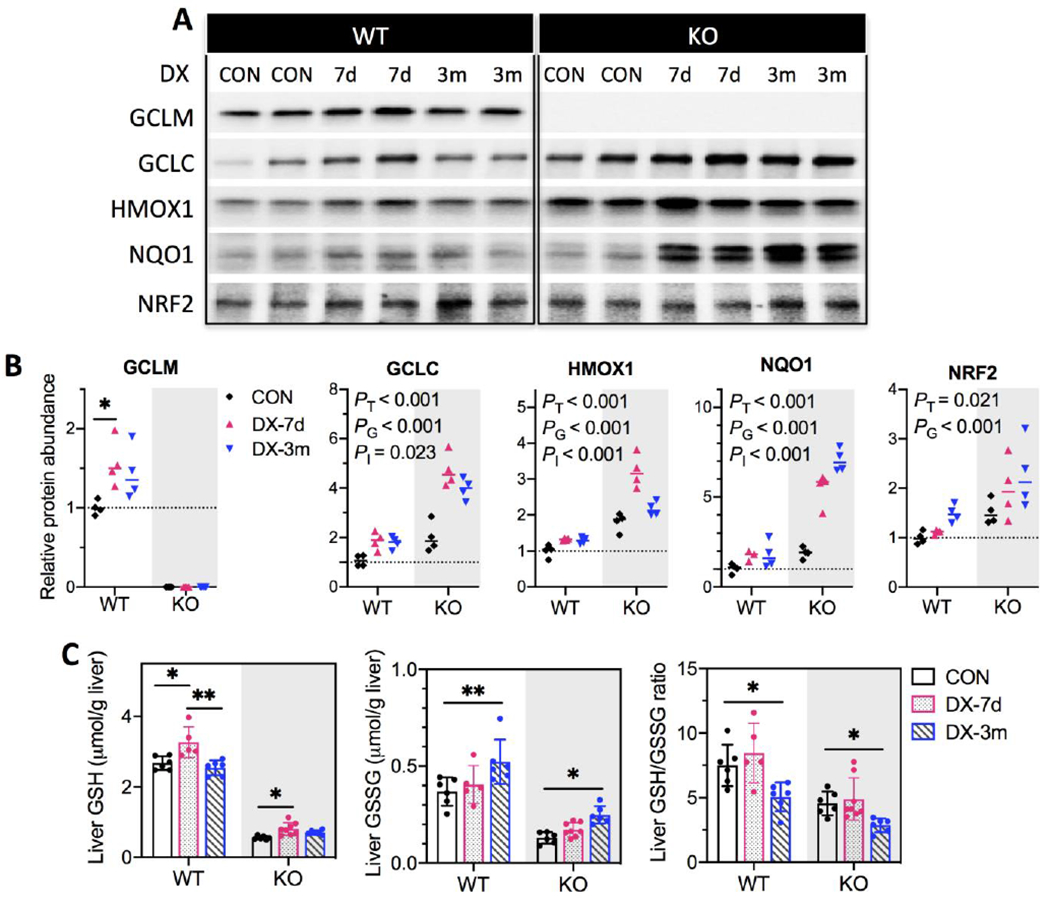
Fig. 3. Expressions of redox sensitive proteins and glutathione concentrations in liver tissues.

(A) Representative Western blotting images for protein expressions using liver whole-cell lysates. (B) proteins levels were quantified by densitometry analysis and normalized to total protein loading per sample. Relative protein abundance was reported as fold of control (WT-CON). Results are presented in Scatter plots showing individual data points from each experimental group with the group median at the line (N = 4/group). Group differences were analyzed using one-way ANOVA with post-hoc Dunnett’s test correction for GCLM protein in WT mice or using two-way ANOVA with post-hoc Bonferroni test correction for all other proteins for the main effects of DX exposures (PT), genotypes (PG), or the interaction between these two factors (PI). P < 0.05 was considered significant. (C) Liver concentrations of reduced (GSH) and oxidized glutathione (GSSG) were measured in whole-cell lysates using a fluorometric assay kit and normalized to liver weight (g). Differences between treatment groups of WT and KO mice, respectively, were analyzed by one-way ANOVA with post-hoc Dunnett’s test correction. Results are presented as mean ± S.D. in Bar plots showing individual data points from each experimental group (N = 5-8/group). P < 0.05 was considered significant. *P < 0.05, **P < 0.01. WT, wild-type mice; KO, Gclm-null mice. CON (black), provided regular water; DX-7d (pink), exposed to DX by gavage for 7 days; DX-3m (blue), exposed to DX in drinking water for 3 months.
