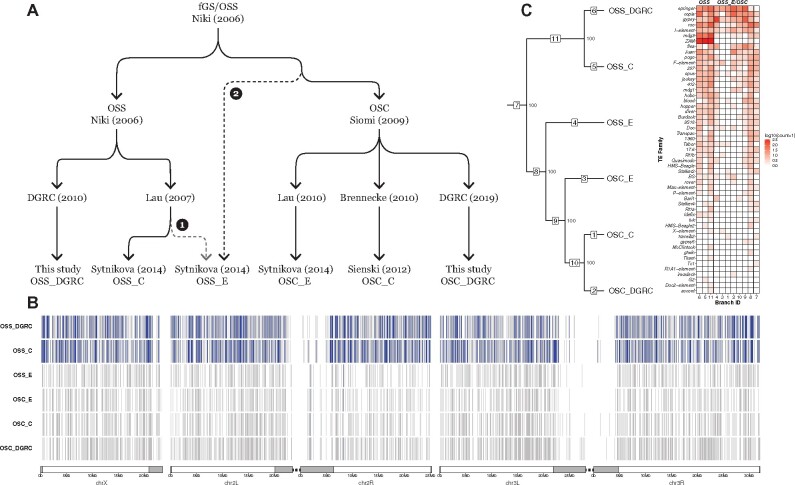
Figure 4.
ZAM proliferation reveals OSS cell line identity. (A) Key events in the history of OSS and OSC cell line creation and distribution. Dotted lines represent alternative hypotheses for the identity of OSS_E. Branch 1 represents the reported provenance that hypothesizes OSS_E is an early-diverging OSS subline; branch 2 hypothesizes that OSS_E approximates an ancestral state of the OSC cell line. (B) Genome-wide non-reference TE insertion data for six ovarian cell lines with ZAM insertions highlighted in blue and all other TE families in gray. (C) Dollo parsimony tree of ovarian cell lines based on all non-reference TE predictions. Numbers inside boxes on branches indicate branch ID, and numbers beside nodes indicate percent support based on 100 bootstrap replicates. (Left) Heatmap showing the number of non-reference TE insertion gain events per family on each branch of the tree based on ancestral state reconstruction using Dollo parsimony. The heatmap is colorized by log-transformed [log10(count + 1)] number of gains per family per branch, sorted top to bottom by overall non-reference TE insertion gains per family across all branches and sorted left to right into the bona fide OSS and OSS_E/OSC clusters (right).

