
FIGURE 3.
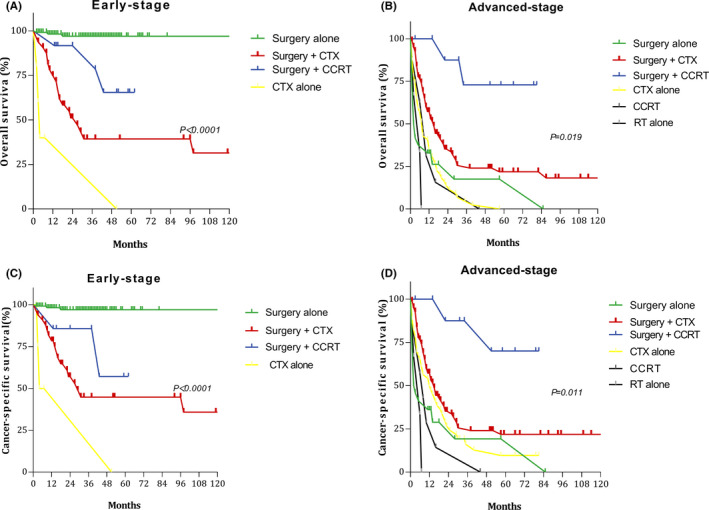
Survival curves for patients with early‐ and advanced‐stage disease for different treatment regimens: (A) overall survival (OS) in the early stage; (B) OS in the advanced stage; (C) cancer‐specific survival (CSS) in the early stage; and (D) CSS in the advanced stage