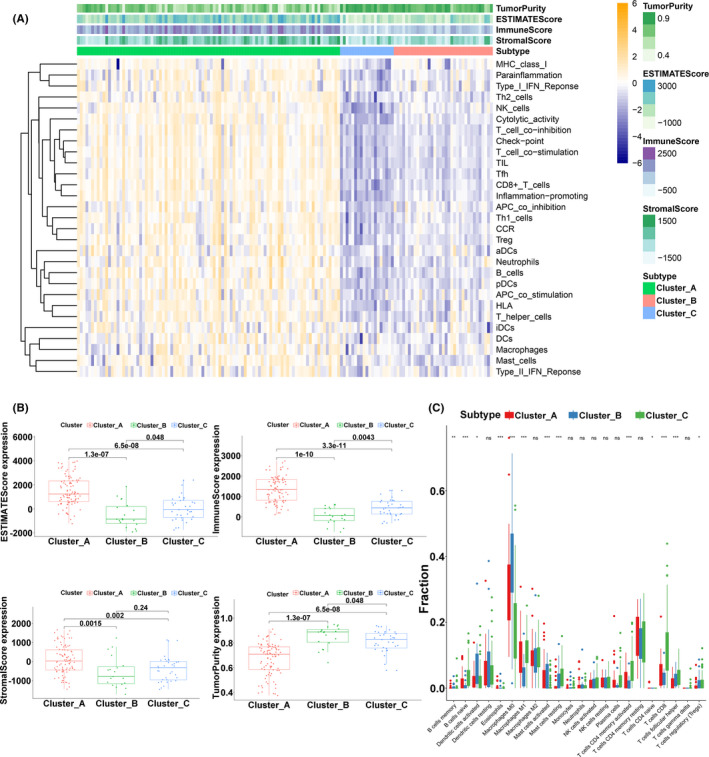
FIGURE 3.

Immune landscape of three clusters. (A) The heatmap of immune gene sets identified by ssGSEA and ESTIMATE scores for the three clusters. (B) Different ESTIMATE scores, immune scores, stromal scores, and tumor purity in three clusters. (C) Different distributions of tumor‐infiltrating cells in three clusters (***p < 0.001, **p < 0.01, *p < 0.05)
