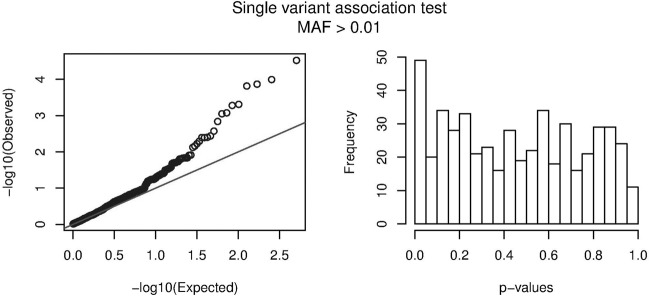
Fig. 1. Evaluation of significance for single variant association tests.
The observed distribution of the p-values for the single variant association tests (for variants with MAF > 1% in controls) is plotted in a Q-Q plot (left) and a histogram (right), showing an enrichment of low p-values. The black line in the Q-Q plot represents the expected null distribution in the absence of any association.

