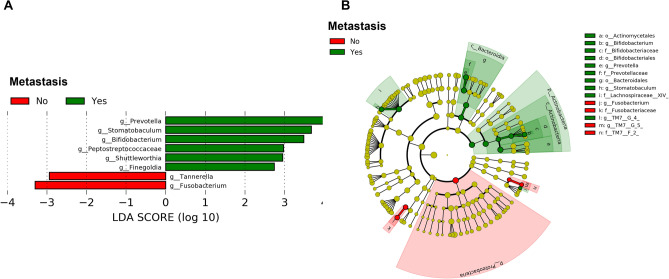
Figure 5.
LDA effect size analysis showing differentially abundant taxa between patients with LNM and non-LNM with a threshold of |log10 LDA|≥ 2. Bar chart showing Log10 LDA of differential taxa in OSCC patients between metastasis and no metastasis groups (A). Cladogram showing the hierarchy among discriminative taxa. From phylum to genus, each node represents a taxonomic level. Red nodes demonstrate enriched taxa in the no metastasis group; green nodes represent enriched taxa in the metastasis group, LDA; linear discriminant analysis, OSCC; oral squamous cell carcinoma.

