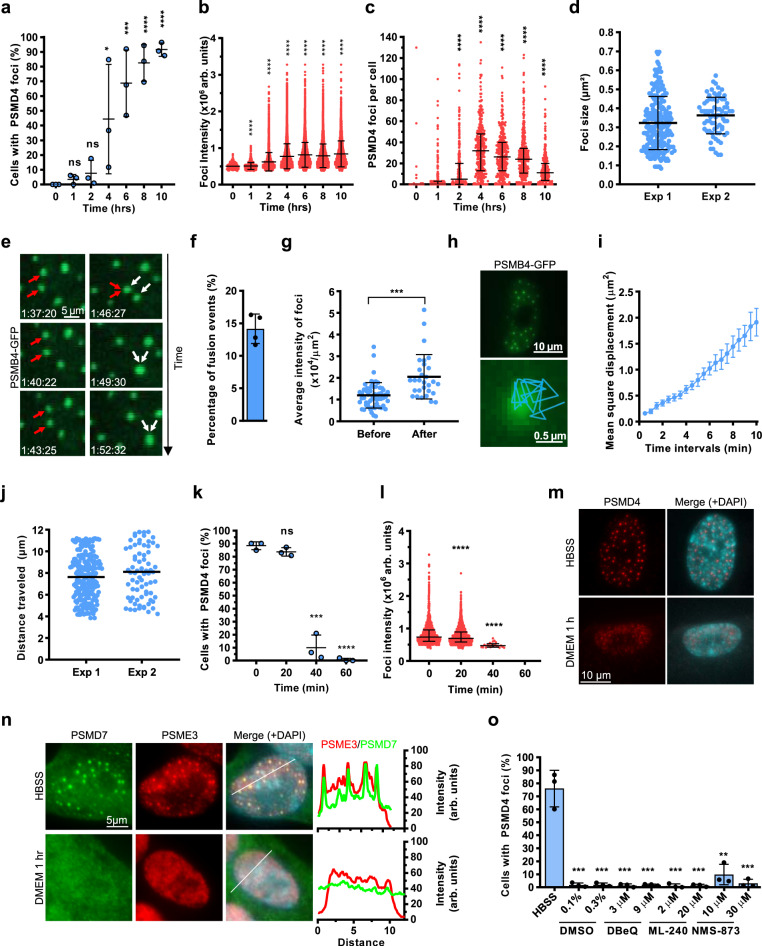
Fig. 5. Rapid dynamics of SIPAN assembly and resolution.
a–c Kinetics of SIPAN formation in IMR90 fibroblasts. a Cells were incubated in HBSS and harvested for immunostaining with PSMD4 antibody. Cells with more than 10 foci were counted (n = 3 independent experiments). b Signal intensity of SIPAN. Images from control and starved cells were used to estimate SIPAN signals (representative from 3 independent experiments). Arbitrary units (arb. units). c Quantification of the number of SIPAN per cell at different time points post-starvation (representative from 3 independent experiments). d Quantification of the size of the traced PSMB4-GFP foci (n = 2 independent experiments). e Time lapse from live-cell imaging indicating SIPAN fusion in vivo. IMR90 cells expressing PSMB4-GFP were incubated in HBSS and used for live imaging. Two fusion events are indicated by arrow of different colors (representative from 3 independent experiments). f Determination of the frequency of PSMB4-GFP foci fusion events over 1 hr (representative from 2 independent experiments). g Comparison of the average intensity of PSMB4-GFP foci in the corresponding cells, before and after fusion events. Note the increase in average intensity after fusion (representative from 2 independent experiments). h A representative image of a 10-min mobility trace of a PSMB4-GFP focus (representative from 2 independent experiments). i A mean-square displacement measurement plot of PSMB4-GFP foci is represented (representative from 2 independent experiments). j Quantification of the distance traveled by PSMB4-GFP foci over 10 min in two independent experiments. Each data point in the distribution plot represents a traced focus (n = 2 independent experiments). k–m SIPAN are reversible. SIPAN formation is induced for 8 hrs and then IMR90 cells were replenished with normal culture medium and harvested for immunostaining. k Cells with more than 10 foci were counted (n = 3 independent experiments). l Signal intensity of SIPAN from nutrient-starved cells and nutrient-replenished cells (representative from 3 independent experiments). m Cell nucleus showing dissipation of PSMD4 signals after medium replenishment (representative from 3 independent experiments). n Resolution of PSME3 foci after nutrient replenishment. IMR90 were incubated 6 hrs with HBSS and then incubated with culture media for 1 hr (representative from 3 independent experiments). o VCP chaperone is not required for SIPAN resolution. IMR90 cells were treated with HBSS solution for 6 hrs and then treated with various inhibitors at the indicated concentrations in complete medium for 1 hr (n = 3 independent experiments). Cells with more than 10 foci are counted. Data represent mean ± SD (a, d, f, g, i, j, k,o) or median with interquartile range for one representative experiment (b, c, l). *P < 0.05; **P < 0.01; ***P < 0.001; ****P < 0.0001; ns: not significant; one-way ANOVA with Holm-Sidak’s (a, k) or Kruskal–Wallis test with Dunn’s test (b, c, l) or 2-sided unpaired Student t-test (g, o). Source data are provided as a Source data file.

