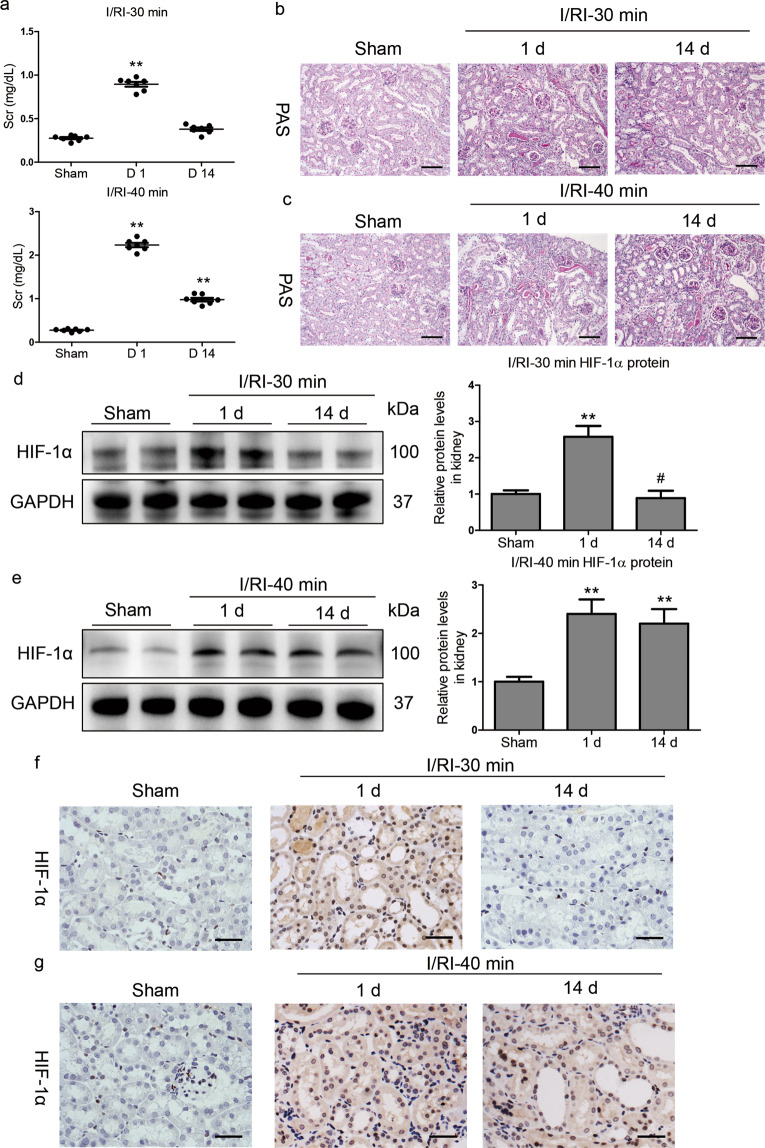
Fig. 2. Sustained activation of HIF-1α is observed in severe AKI without recovery.
a Scr levels were assayed at the indicated time points after 30 or 40 min of I/RI. b, c Representative histological changes (PAS staining) at the indicated time points after 30 or 40 min of I/RI (n = 7). Scale bar, 100 μm. d, e Western blots of HIF-1α protein expression in kidney cortex tissues (n = 7). f, g Representative images of HIF-1α immunostaining in kidneys from mice after 30 or 40 min of I/RI. Scale bars, 50 μm. Data are presented as the mean ± SEM of 7 mice. D1, day 1; D14, day 14. **P < 0.01 versus the sham control (Dunnett’s test); #P < 0.05 versus D1 (Bonferroni correction, 2 comparisons were made).

