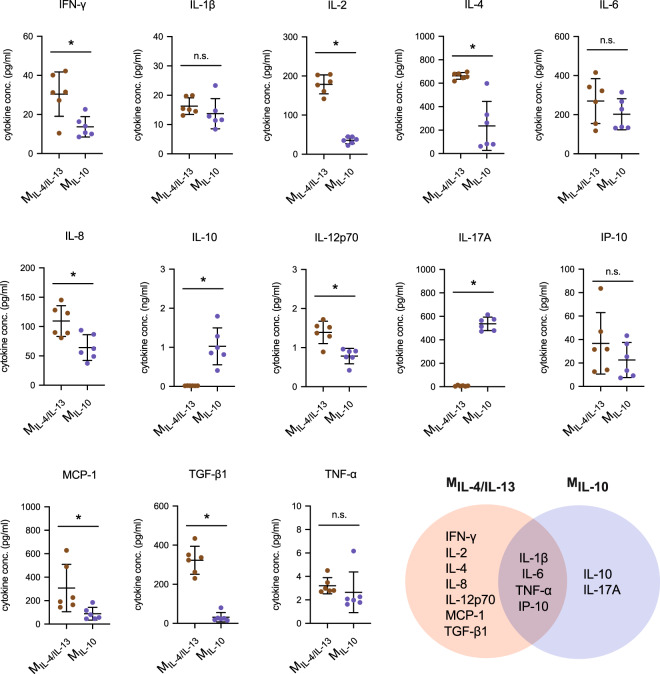
Fig. 3. Quantitative analysis of cytokine secretion profile of MIL-4/IL-13 and MIL-10.
Cytokine secretion profile was analyzed from cell culture supernatants after 3 days of macrophage activation by a bead-based multiplex immunoassay using flow cytometry. Data are shown as a dot plot. Black line and error bar in the plot represent mean and standard deviation, respectively. * indicates a significance level of p ≤ 0.05 using Mann–Whitney test. Experiments were performed in six independent replicates.

