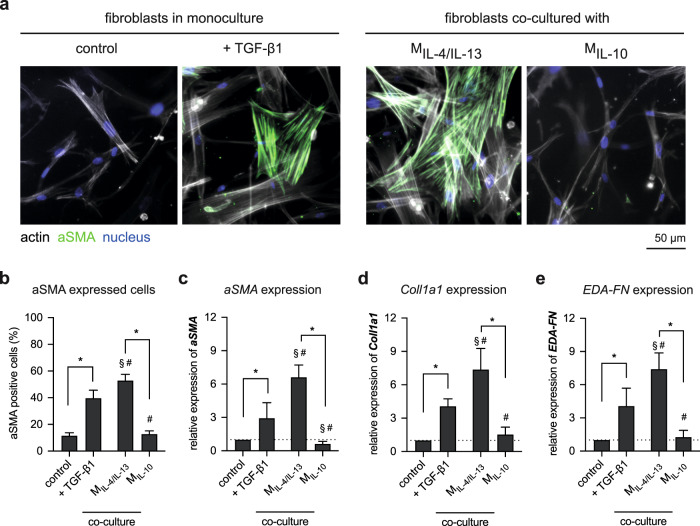
Fig. 4. Alteration of fibroblast morphology and specific markers in the presence of TGF-β1 and co-culture with M2 macrophages subtypes.
a Representative images showing nuclei (blue), actin filaments (gray), and αSMA (green) (scale bar: 50 μm). Fibroblast differentiation was analyzed by b manual counting of αSMA-positive cells. At least 200 cells per condition were counted. Gene expression analysis of c αSMA, d Coll1a1, and e EDA-FN were performed using qPCR. Data are represented as mean ± SD; *a significance level of p ≤ 0.05 using a one-way ANOVA followed by Tukey’s post hoc analysis. The characters # and § represent the significance level of p ≤ 0.05 using a one-way ANOVA followed by Tukey’s post hoc analysis when compared to control, and treated samples with TGF-β1, respectively. Experiments were performed in four replicates.

