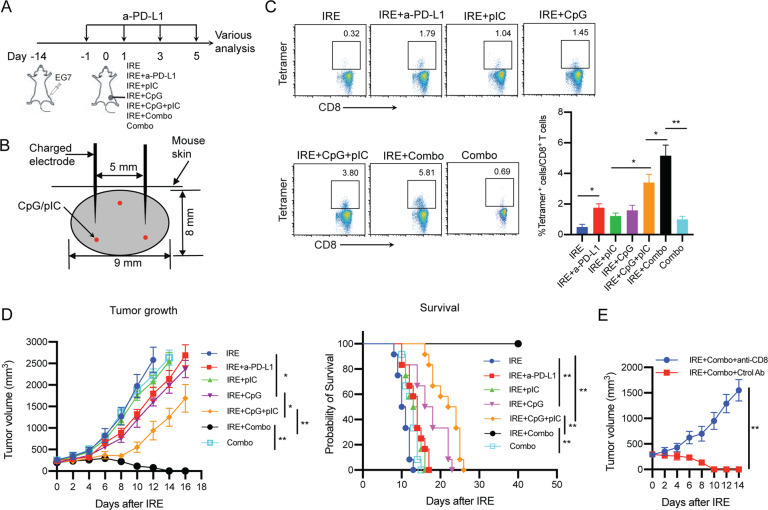
Fig. 3. IRE combined with PD-L1 blockade and TLR3/9 agonists results in potent OVA-specific CD8+ T cell responses and antitumor immunity.
A Schematic diagram of IRE ablation combined with PD-1 blockade (anti-PD-L1 Ab) and/or TLR3/9 agonists (pIC/CpG) in six protocols: (i) IRE, (ii) IRE + anti-PD-L1, (iii) IRE + pIC, (iv) IRE + CpG, (v) IRE + pIC/CpG, (vi) IRE + Combo and (vii) Combo alone (treatment schedules described in the Methods). B Schematic illustrating IRE device electrode placement and pIC/CpG injection points (red color) in the tumor (8–9 cm in diameter) during IRE ablation. C Blood cells collected from the tail vein of mice treated with each of the above six different protocols (n = 4/group) were stained with OVA-specific PE-Tetramer and a FITC-conjugated anti-CD8 antibody and analyzed by flow cytometry. The value in each panel represents the percentage of OVA-specific CD8+ T cells in the total CD8+ T cell population. **P < 0.01 by one-way ANOVA with Tukey’s test. D Tumor-bearing mice were monitored for tumor growth or regression. *P < 0.05, **P < 0.01 by two-way ANOVA with a post hoc Tukey’s test. Tumor-bearing mice were also monitored for mouse survival post IRE ablation. Kaplan–Meier survival analysis for the same experiments (n = 12/group) with the log-rank test. **P < 0.01. E Tumor growth curves of IRE + Combo-treated tumors with and without depletion of CD8+ cells using anti-CD8 and control antibodies. Tumor growth or regression was monitored. Tumor-bearing mice were monitored for tumor growth post IRE + Combo ablation. **P < 0.01 by two-way ANOVA with Tukey’s test. Tumor growth plots representing one of two independent experiments are presented as the mean ± SEM (n = 4/group)

