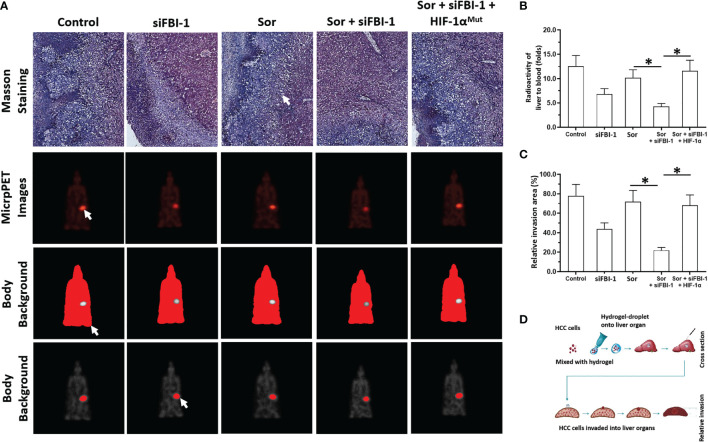
Figure 7.
siFBI-1 enhanced the resistance of MHCC97-H cells to Sorafenib in a nude mice model. The MHCC97-H cells were transfected with vectors and injected into the nude mice to form the intrahepatic invasion models. The mice received the oral administration of 0.5 mg/kg Sorafenib. The results are shown as Masson staining (A) micro-PET images (A), and the quantitative results of micro-PET images (A, B) or Masson staining images (C). The flow chart/model diagram of the intrahepatic invasion model is shown as Panel (D). The white arrow indicated the intrahepatic lesions via Masson staining (A), the images of the intrahepatic lesions via micro-PET images (A), the body background to quantitatively analyze the micro-PET images (A) or the liver region to quantitatively analyze the micro-PET images (A). *p < 0.05.

