
Fig. 2.
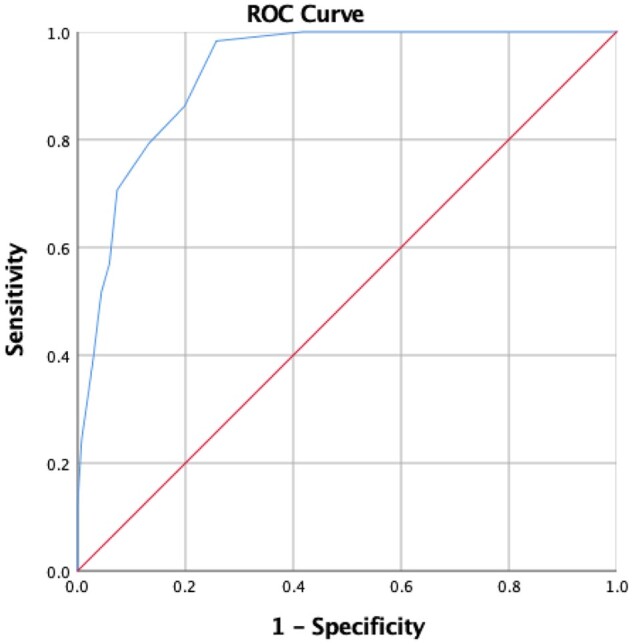
Receiver operating characteristic curve for GCA probability score
The area under the receiver operating characteristic curve for the 194 patients with a calculated GCAPS was 0.927 (95% CI: 0.892, 0.961). The optimal cut-off point for the curve was 9.5 points. GCAPS: GCA probability score.