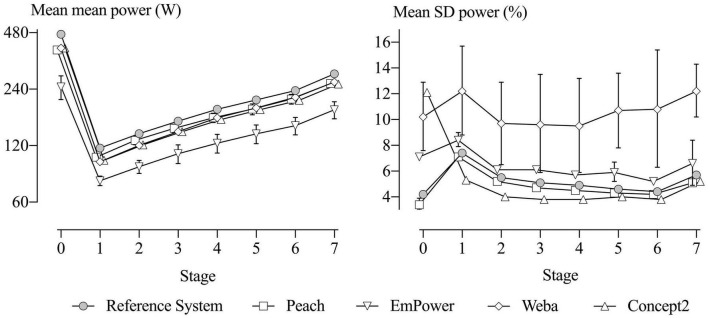
FIGURE 7.
Means of the mean (left) and SD (right) of power for each device in each stage for all the testing sessions. SD bars represent between-unit SD for the means and SD. The Reference System and the Concept2 have no SD bars, as only one unit was tested. SD bars on the right are omitted from some stages for Peach and EmPower, reflecting negative variance. Stage 0 represents the 30-s maximal test.

