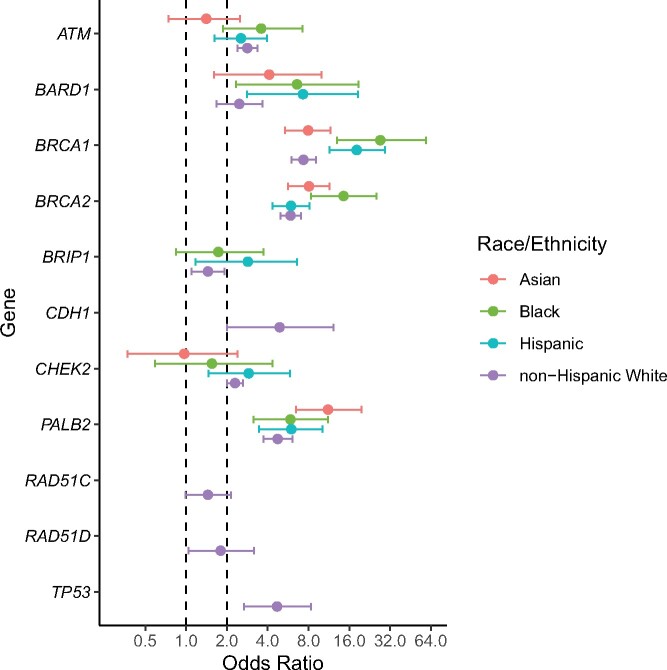
Figure 1.
Forest plot for case-control comparisons of frequency of pathogenic variants between breast cancer cases and ethnicity- and race-matched reference controls in gnomAD. Plots show odds ratios and 95% confidence intervals for each gene in 4 common race and ethnicity groups. Odds ratios are not shown for genes with less than 5 pathogenic variants in cases or controls. Dashed lines are presented at odds ratios of 1 and 2, the latter representing the threshold at which pathogenic variants in a gene may be considered to confer moderate risk of breast cancer.

