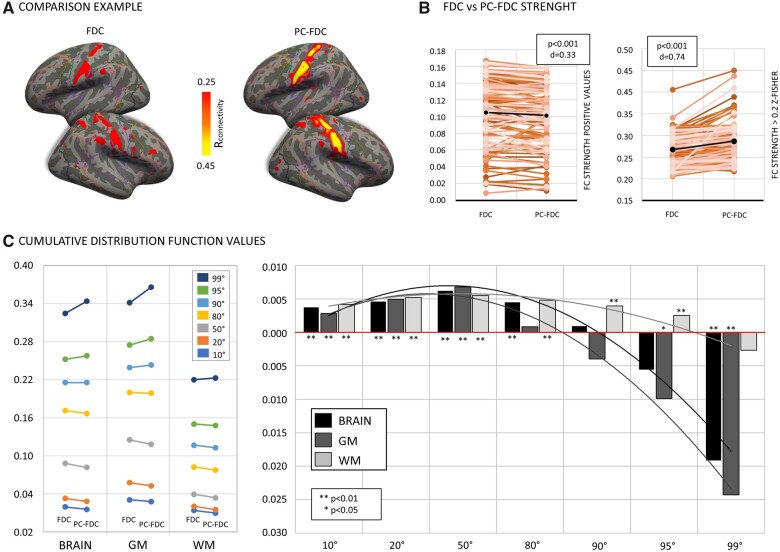
Figure 2.
Functional connectivity strength. (A) Representative PC-FDC and FDC network-maps overlapping with the sensory-motor network. (B) Connectivity networks strength difference between PC-FDC and FDC for positive values (left) and z-Fisher > 0.2 (right). (C) Left panel shows connectivity values associated at different cumulative distribution function cut-offs for the FDC and the PC-FDC; right panel reports values as difference between FDC and PC-FDC connectivity maps [values are reported for the whole brain (black), grey matter (dark-grey) and white matter (light-grey) masks]. The Wilcoxon signed-ranks test was used to compare the connectivity profile between FDC and PC-FDC maps. P-values (P) and Cohen’s effect size (d) are reported.

