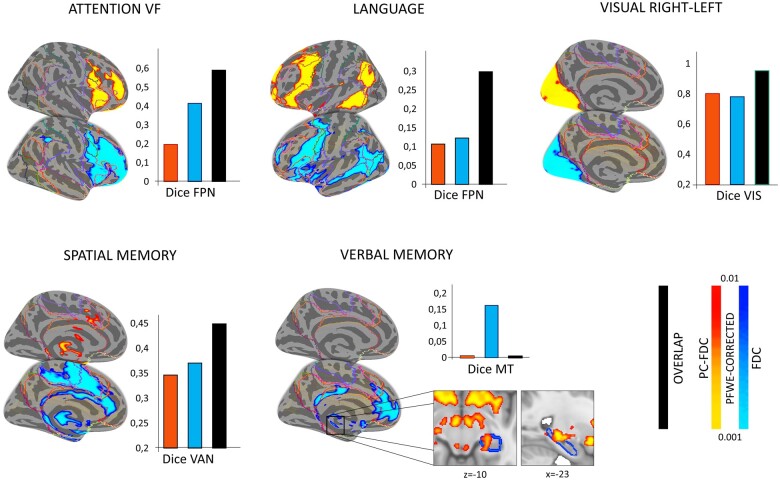
Figure 6.
Voxel-wise correlation between connectivity and behaviour. Univariate maps from the PC-FDC (blue) and FDC (red) approach showing clusters linked with behaviour (simple linear correlation through nonparametric threshold-free cluster enhancement approach; n = 5000 permutation) covarying for lesion size (volume). Results are co-registered to the fsaverage surface and showed at pFWE < 0.01. For each significant univariate map, the corresponding dice coefficient with canonical template is showed (inset bar plots). FPN = frontoparietal network; MT = memory network; VAN = ventral-attention network; VIS = visual network. Lines outline Yeo’s 7 networks subdivision.

