Figure 1.

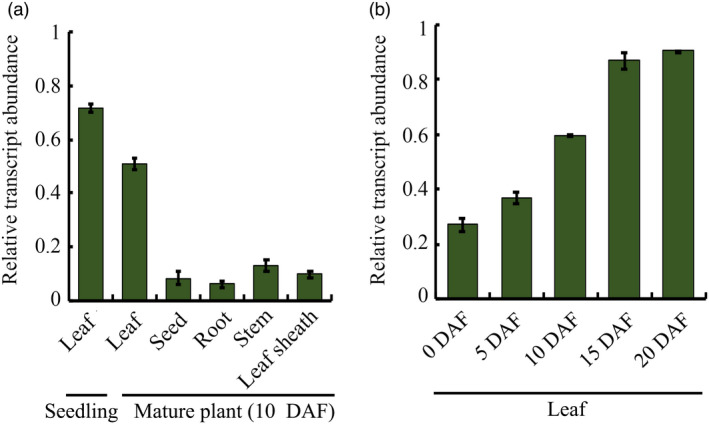
Spatial and temporal expression analysis of Osl2 in rice. (a) Expression analysis of Osl2 in different tissues of rice. (b) Expression of Osl2 in rice leaves at different stages of senescence. DAF, day after flowering. The rice Actin gene was the internal control for normalization of gene expression. Error bars represent SDs. Each experiment was repeated at least three times
