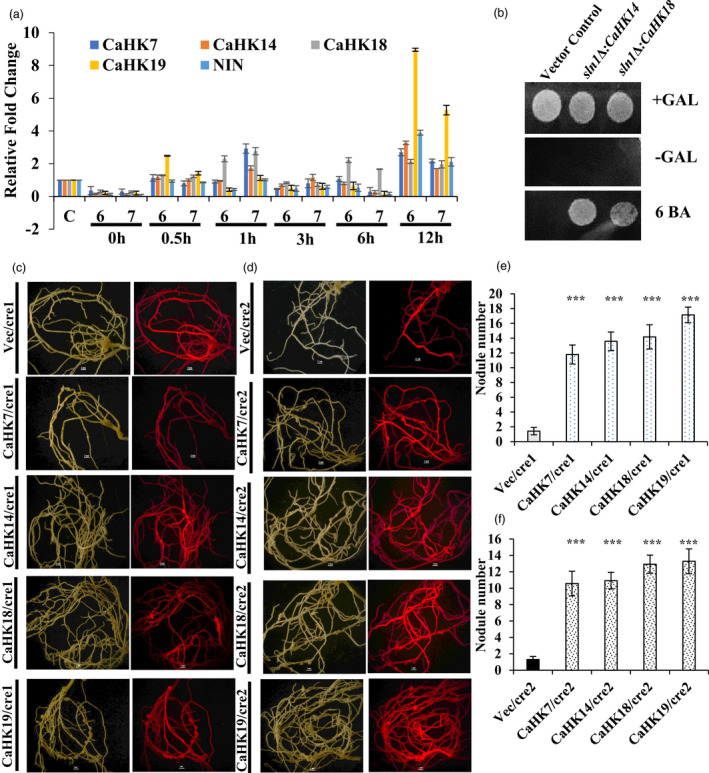
Figure 2.

qRT‐PCR expression and heterologous expression of CaHKs. (a) Bar diagram represents the expression profiles of CaHKs and CaNIN after treatment of chickpea seedlings with 6‐BA at two concentrations (6 denotes 2.5 × 10⁻⁶ M and 7 denotes 2.5 × 10‐7 M) at 0 min, 30 min, 1h, 3h, 6h and 12h. ‘C’ denotes untreated control plants. The experiments were carried out in triplicates (n = 15 plants) and expressed as means ± S.E. (b) Yeast drop assay for complementation of yeast mutant sln1∆ with CaHK14 and CaHK18. (c) Complementation of ∆cre1‐1 Medicago mutants with CaHKs. (d) Complementation of ∆cre1‐2 Medicago mutants with CaHKs. Panel 1 represents visualization in white light, and panel 2 represents visualization under red fluorescence. (e) Bar diagram represents the number of nodules in the CaHKs complemented ∆cre1‐1 mutant lines (*** represents t‐test P‐value ≤ 0.0001). (f) Bar diagram represents the number of nodules in the CaHKs complemented ∆cre1‐2 mutant lines (*** represents t‐test P‐value ≤ 0.0001). The experiments were carried in triplicates (n = 15 plants) and expressed as means ± S.E.
