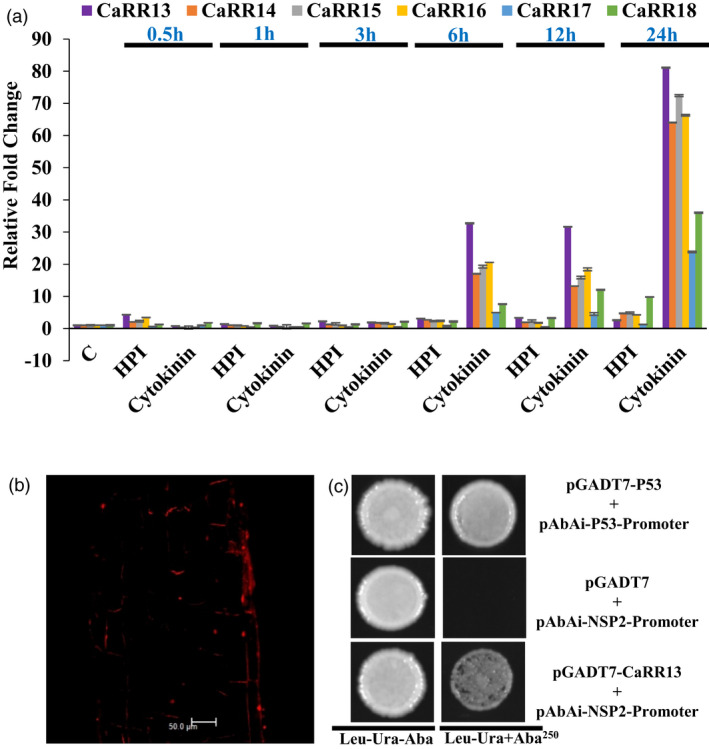
Figure 3.

Functional characterization of CaRR13. (a) Bar diagram represents the expression profiles of CaRRs during control (c), M. ciceri treatment (expressed as HPI) and cytokinin (2.5 × 10⁻⁷M 6‐BA). The experiments were carried out in triplicates and expressed as means ± S.E. (b) Subcellular localization of CaRR13 (c) Interaction of CaRR13 with NSP2 promoter using yeast one hybrid analysis. Strong interaction was observed on Ura and Leu deficient plates in the presence of aureobasidin A (AbA250). P53 promoter and AD‐Rec‐P53 were used as a positive control.
