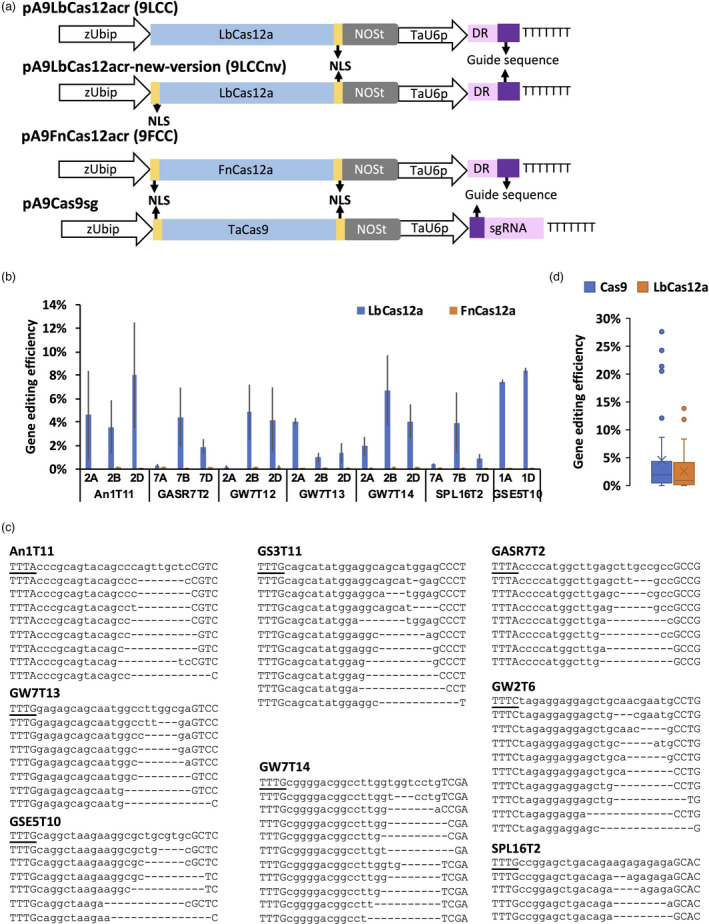
Figure 1.

LbCas12a but not FnCas12a induces mutations in the wheat genome. (a) A schematic illustration of plasmids pA9LbCas12aCr (9LCC for short), pA9LbCas12aCr‐new‐version (9LCCnv for short), pA9FnCas12aCr (9FCC for short) and pA9Cas9sg. Both the maize Ubiquitin promoter and wheat U6 promoter are shown with open arrows and marked as zUbip and TaU6p, respectively. The coding sequences of LbCas12a, FnCas12a and wheat codon‐optimized Cas9 (TaCas9) are shown as blue rectangles. The NLS peptide sequences that flank the Cas12a coding sequences are shown as yellow rectangles. The NOS poly A terminator is shown as grey rectangle and marked as NOSt. The direct repeat (DR) and guide sequence of crRNA are shown as pink and purple rectangle, respectively. The sequence of seven ‘T’ bases is terminator for TaU6p. (b) The comparison of the normalized gene editing efficiency between LbCas12a (9LCC/9LCCnv) and FnCas12a (9FCC). As the construct 9LCC and 9LCCnv showed no significant difference (P > 0.05 by student TTEST) on gene editing efficiency at target GSE5T10 and GS3T11 (Table S2), data of targets gotten assessed by either 9LCC or 9LCCnv were all used for the comparison between LbCas12a and FnCas12a. The 9LCC data of GSE5T10 from Table S2 was selected to prepare this plot because it showed the lower levels of variability in gene editing efficiency compared to 9LCCnv. The bar plots showed the data as mean ± standard error. Each target had three biological repeats. In cultivar Bobwhite, the B genome homoeolog of TaGSE5 is highly divergent from the A and D genome copies and could not be targeted by the designed gRNA. (c) The representative NGS reads generated for regions targeted by CRISPR‐LbCas12a. The sequences of the wild‐type alleles are shown on the top. The PAM and target sequences are shown as underlined and lower‐case letters, respectively. (d) The comparison of average gene editing efficiency for Cas9 (21 targets) and LbCas12a (12 targets) calculated for genes TaGS3, TaGW7, TaPDS and TaGSE5 (Table S2 and Table [Link], [Link]). The duplicated target sites in the A, B and D genomes were treated as independent targets. The gene editing efficiency of each target was normalized by protoplast transformation efficiency. The means of two or three biological replicates for each target were used to make the box and whisker plot.
