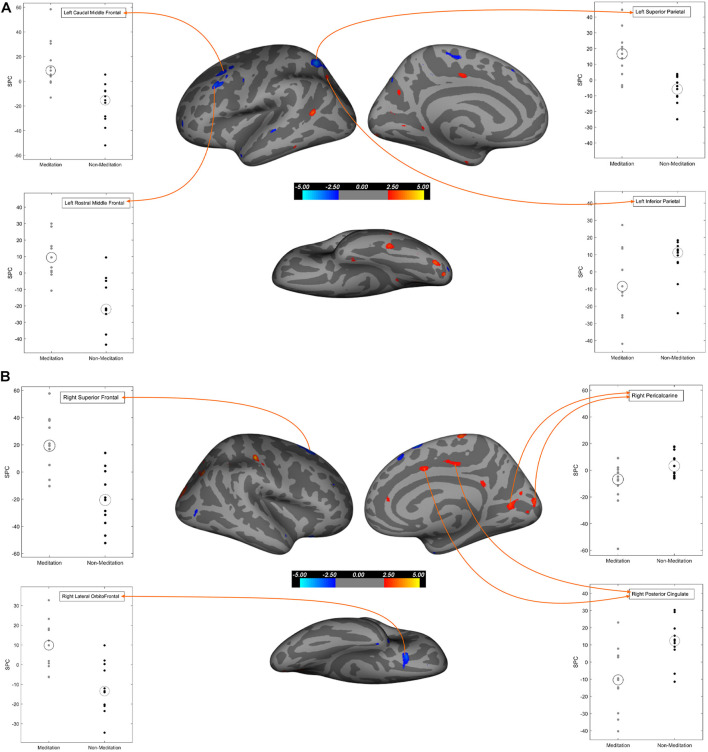
FIGURE 1.
Regions of cortical thickness that exhibit significant differences between meditation and non-meditation cohorts corrected for multiple comparisons, age, gender, and education. In all three different views (Lateral, medial, inferior) of brain surfaces, the blue clusters represent significantly higher SPC values while the red clusters represent significantly lesser SPC values in the meditation group compared to the non-meditation group. Graphs for significantly large cluster sizes are annotated on the inflated brain surface (see Table 5 for more details). (A) Left hemisphere; (B) Right hemisphere.

