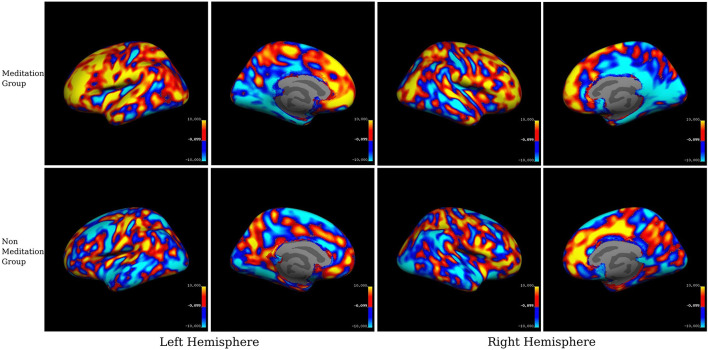
FIGURE 3.
Within-group averaged SPC changes for cortical thickness in the meditation (Group1) and the non-meditation (Groups2+3) groups. Positive values (red-yellow) correspond to the increased cortical thickness and negative values (light blue-dark blue) corresponds to decreased cortical thickness. The voxels with SPC between –0.1 and +0.1 have been left uncolored. The top panel represents the meditation group while the lower panel represents the non-meditation group.

