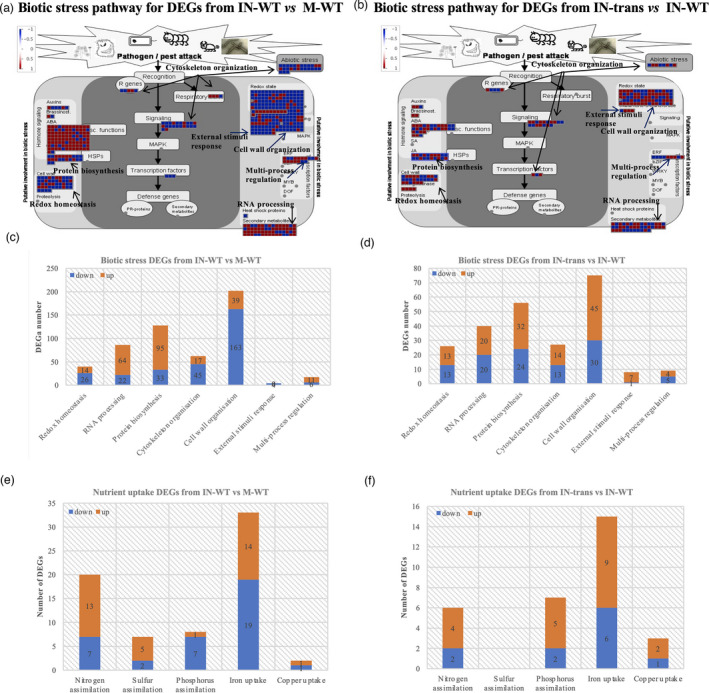
Figure 3.

MapMan analyses of differentially expressed genes (DEGs) in biotic stress pathway and nutrient uptake process. (a) Biotic stress pathway analysis for DEGs from comparison between IN‐WT and M‐WT. (b) Biotic stress pathway analysis for DEGs from comparison between IN‐trans and IN‐WT. (c) The number of up‐ and down‐DEGs from comparison between IN‐WT and M‐WT in specific biotic stress categories. (d) The number of up‐ and down‐DEGs from comparison between IN‐trans and IN‐WT in specific biotic stress categories. (e) The number of up‐ and down‐DEGs from comparison between IN‐WT and M‐WT in specific nutrient assimilation categories. (f) The number of up‐ and down‐DEGs from comparison between IN‐trans and IN‐WT in specific nutrient assimilation categories. The red and blue colours indicate the log2 fold change of DEGs, showing up‐ or down‐regulated genes, respectively. The metabolic pathways were generated with MapMan software; IN‐trans, IN‐WT, and M‐WT are abbreviations for inoculated‐transgenic, inoculated‐WT, and mock‐WT, respectively.
