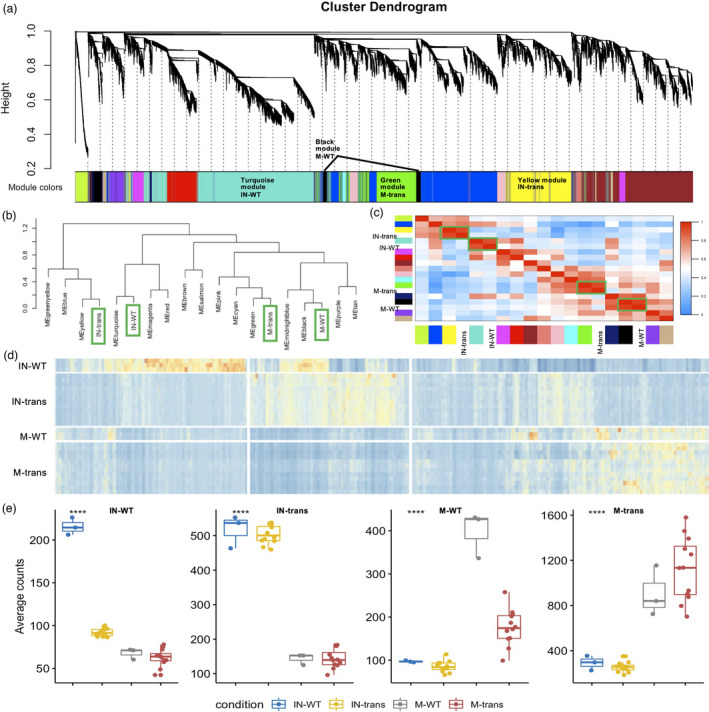
Figure 4.

Network analysis of switchgrass root genes. (a) Hierarchical cluster tree showing co‐expression modules identified using WGCNA. Modules correspond to branches and are labelled by colours as indicated underneath the tree. The average gene expression values of all the replicates from the respective condition were used to build the network. (b) Dendrogram tree showing the distance amongst conditions and different coloured‐modules. (c) Heatmap showing the correlation between modules and conditions. The green boxes highlight the correlated conditions and modules. The reported modules and conditions (x‐axis) are often highly correlated with distinct conditions and modules (y‐axis). Colour legend indicates the level of correlation module and condition. (d) Heatmap of co‐expression groups for differentially expressed genes across the four conditions. The vertical axis organizes genes according to replicates in conditions, and the horizontal axis shows individual gene in the conditions labelled on the y‐axis. The colour codes from blue to red indicate the gene expression value from low to high. (e) Boxplots show the distribution of groups expression (mean RPKM of all genes within a given group) for different genotype and inoculation conditions. IN‐WT, inoculated‐WT; IN‐trans, inoculated‐transgenic; M‐WT, mock‐WT; M‐trans, mock‐transgenic; respectively.
