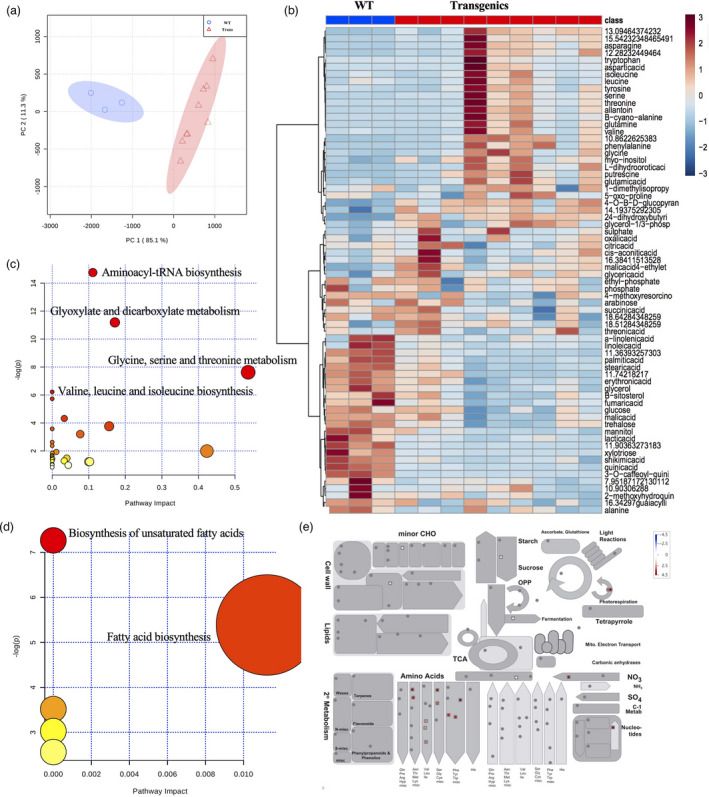
Figure 6.

Metabolite response in switchgrass roots inoculated with Laccaria bicolor. (a) PCA separation of switchgrass WT from the transgenic samples. (b) Heatmap showing regulated metabolites in WT and transgenic roots in response to L. bicolor inoculation. (c) High abundance metabolites pathway enrichment analyses. (d) Low abundance metabolites pathway enrichment analyses. The ball size indicates the pathway impact, calculated by the compound number observed divided by the total compound number in the pathway. (e) Overview of the metabolic pasthways that the differential abundance metabolites are involved in. The red and blue colours indicate the log2 fold change of differential abundance metabolites, showing high or low abundance metabolites, respectively. The metabolic pathways were generated with MapMan software.
