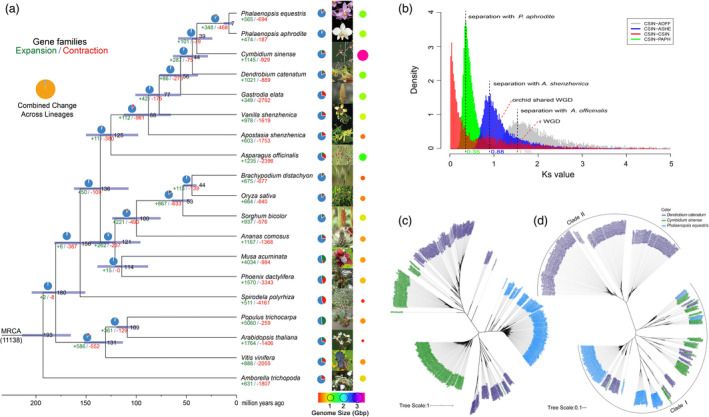
Figure 2.

Evolution of Cymbidium sinense genome and gene families. (a) Phylogenetic tree showing divergence times and the evolution of gene family sizes. The phylogenetic tree was constructed from a concatenated alignment of 152 single‐copy gene families from 19 green plant species. Gene family expansions are indicated in orange, and gene family contractions are indicated in grey; the corresponding propotions among total changes are shown using the same colours in the pie charts. Inferred divergence dates (in millions of years) are denoted at each node in blue. MRCA, most recent common ancestor. Blue portions of the pie charts represent the conserved gene families. The corresponding genome size is shown using the different colour and size point. (b) KS distribution analysis. Distribution of KS for the one‐to‐one C. sinense–D. catenatum, C. sinense–P. equestris and C. sinense–A. officinalis. (c) Phylogenetic relationships within the Ty3/Gypsy superfamily in the three orchid species. (d) Phylogenetic relationships within the Ty1/Copia superfamily in the three orchid plants.
