Figure 1.

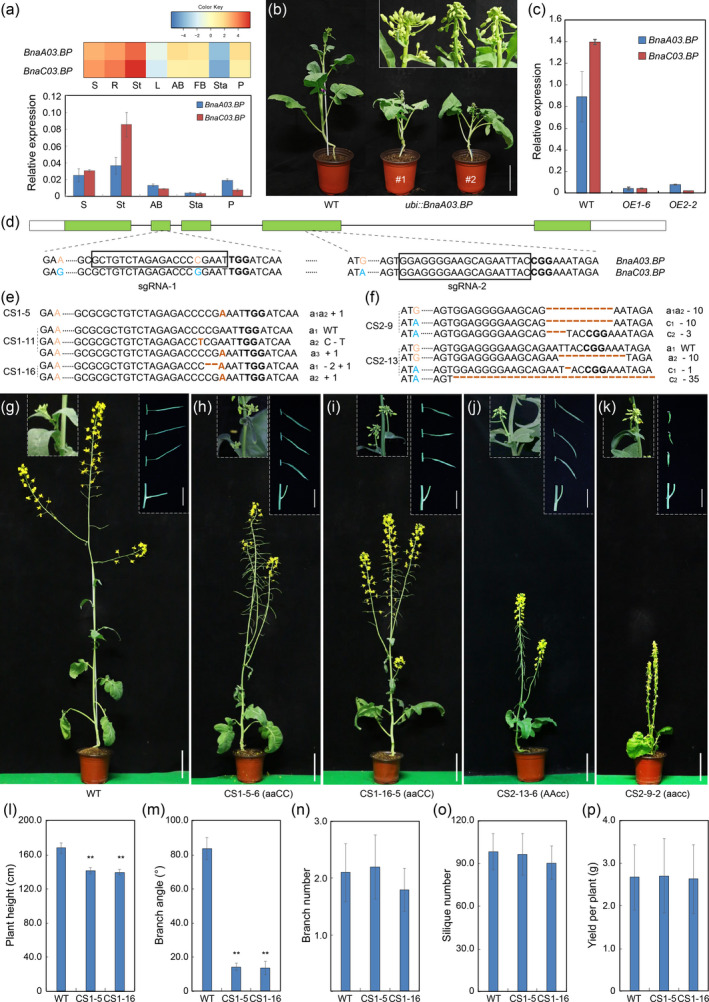
CRISPR/Cas9‐targeted mutagenesis of the BnaBP genes confers semi‐dwarf and compact architecture in rapeseed. (a) Heat‐map and qRT‐PCR analysis of the expression of BnaBP genes in various tissues of wild type (WT). Error bars ± standard deviations (n = 3). AB, axillary bud; FB, flower bud; L, leaf; P, pistil; R, root; S, seedling; St, stem; Sta, stamen. The BnaTMA7 gene was used as an internal control. (b) Morphological comparison of WT and ubi: BnaA03.BP transgenic lines at bolting stage. Bar = 15 cm. (c) qRT‐PCR of BnaBPs in pedicels from 6‐week‐old T2 plants. The BnaTMA7 gene was used as an internal control. (d) CRISPR/Cas9 sgRNA‐1 targets the second exon of BnaA03.BP and sgRNA‐2 targets the fourth exon of both BnaBPs. The orange or blue colours indicate the SNP upstream or on the sgRNA target to distinguish the homologous sequences. The protospacer adjacent motif (PAM) is indicated in bold. The box indicates the target sequences. (e–f) Sequencing of the BnaBP sites targeted by sgRNA‐1/2. Brown colours and hyphens in target sequences indicate insertions and deletions respectively. a1, a2, c1 and c2 indicate the four BnaBP alleles respectively. a3 indicates the chimeric allele. The remaining editing events are not shown in this figure. (g–k) Morphological comparison of WT, BnaA03.BP (aaCC), BnaC03.BP (AAcc) and BnaBPs (aacc) homozygous mutant plants at the reproductive stage. Bars = 15 cm. Dashed regions from left to right and top to bottom are as follows: morphology of axillary buds, pedicel and branch angle. Bars = 5 cm. (l–p) Statistical analysis of plant height, branch angle, branch number, silique number and yield per plant in WT, CS1‐5‐6‐2 and CS1‐16‐5‐1 homozygous plants in the green house. Error bars ± standard deviation (n = 10). Student’s t‐test was used for statistical analysis (*P ≤ 0.05; **P ≤ 0.01).
